
'%20x='0'%20y='0'%20height='100%25'%20width='100%25'%20%0A%20%20%20%20%20%20%20%20%20%20xlink%3Ahref='data:image/jpg;base64,/9j/2wBDAAYEBQYFBAYGBQYHBwYIChAKCgkJChQODwwQFxQYGBcUFhYaHSUfGhsjHBYWICwgIyYnKSopGR8tMC0oMCUoKSj/2wBDAQcHBwoIChMKChMoGhYaKCgoKCgoKCgoKCgoKCgoKCgoKCgoKCgoKCgoKCgoKCgoKCgoKCgoKCgoKCgoKCgoKCj/wgARCAAGAAoDASIAAhEBAxEB/8QAFAABAAAAAAAAAAAAAAAAAAAABv/aAAgBAQAAAABQP//EABQBAQAAAAAAAAAAAAAAAAAAAAP/2gAIAQIQAAAAL//EABQBAQAAAAAAAAAAAAAAAAAAAAH/2gAIAQMQAAAAf//EACAQAAICAQMFAAAAAAAAAAAAAAECAwQABQYTESJhktL/2gAIAQEAAT8Ai2RYqapcevaR6saRFI2Yoe4PyHqo8AjBuAkA8MfqfrP/xAAWEQADAAAAAAAAAAAAAAAAAAAAAjL/2gAIAQIBAT8AST//xAAWEQEBAQAAAAAAAAAAAAAAAAABAEH/2gAIAQMBAT8A1L//2Q=='%3E%3C/image%3E%3C/svg%3E)
They say you don’t remember what people did for you, just how they made you feel. That is amazingly true when it comes to cricket as well. A few years after players walk into the twilight of their careers, we are not so concerned anymore about their numbers – runs, averages, centuries, double-centuries or matches. Numbers contribute to hubris while class contributes to the aura.
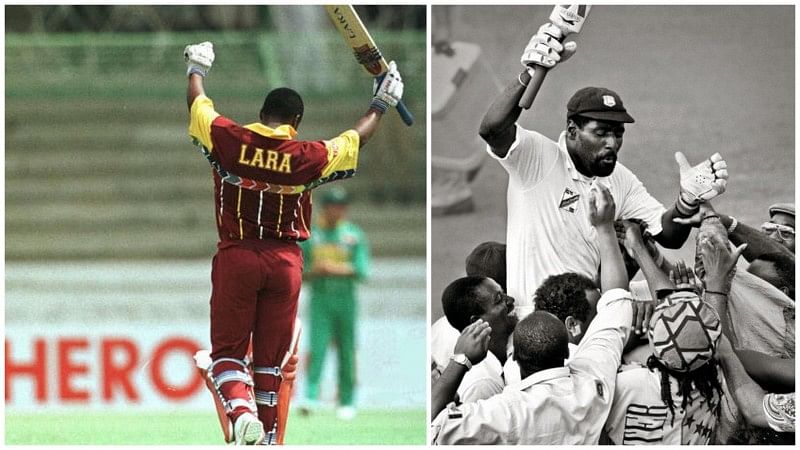
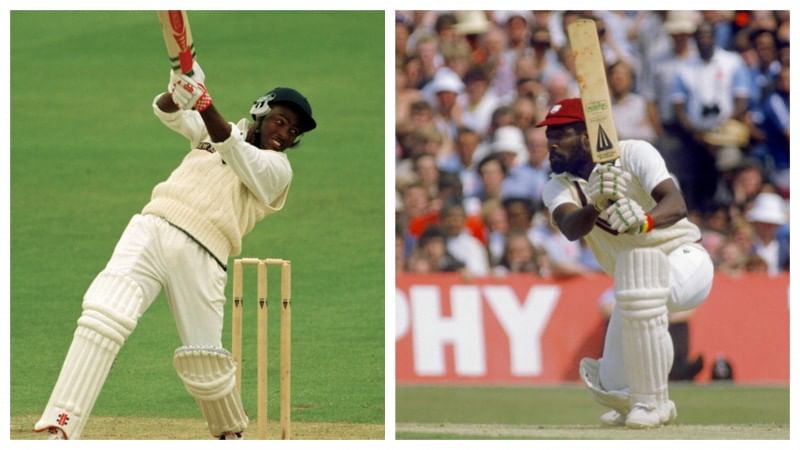
And when it comes to the aura, the general charisma of a player, the respect and adoration they demanded of players and audiences alike, there aren’t too many ahead of two West Indian greats, Brian Lara and Sir Vivian Richards.
In their approach to cricket they were similar people – proud of what they represented, classy, possessed of a swashbuckling swagger, they managed from time to time to become larger than life, when the game and all its irrelevant paraphernalia just halted to witness majesty in full flow. Interestingly, Lara made his debut just a year before Richards played his last, which meant West Indies got lucky, gifted with a like-for-like replacement, something that rarely happens when teams are in transition.
By the time Lara ended his career, West Indies wasn’t a dominant power anymore; but on his day, like South Africa can remember from the 1996 World Cup, Lara won matches single-handedly.
Two different eras, two different teams, different levels of opposition, different times. What is the same between Lara and Richards though is the fact that they were both the pivots around which the plans of their team revolved.
Richards had a slightly easier time considering he had the powerful opening pair of Desmond Haynes and Gordon Greenidge to batter the bowling and then a lower order that had players like Clive Lloyd. On the other hand Lara had middle order players like Carl Hooper and Shivnarine Chanderpaul but never really had the kind of intimidating firepower in his team in terms of batting that Richards had.
We thought it’d be a good idea to compare the statistics and records of the two great West Indian batsmen. So here goes:
Overall records
| Overall | Innings | Runs | Average | 100s/50s |
|---|---|---|---|---|
| Brian Lara | 232 | 11953 | 52.88 | 34/48 |
| Vivian Richards | 182 | 8540 | 50.23 | 24/45 |
Lara had 82 50+ scores in 232 innings while Richards had 69 out of 182. The ratios work out to be extremely similar – 0.35 and 0.37 respectively, showing that both contributed with a significant score a similar number of times per innings played. Lara, however, averaged 2.5 runs more per dismissal which at the end of a career can be quite a big number, especially considering that he played for a weaker team than Richards did.
Performance at home and away
Interestingly, Lara has played a lot more at home than Richards did, who played a lot away from home. Lara has a way better average at home while Richard averages better away, the sign of an excellent player. In Richards’ favour, one should also note that the difference between his home and away averages is minute while it is more than 10 points for Lara, showing Richards was the more consistent player across different conditions.
| Home | Innings | Runs | Average | 100s/50s |
|---|---|---|---|---|
| Brian Lara | 111 | 6217 | 58.65 | 17/26 |
| Vivian Richards | 67 | 3136 | 49.77 | 11/14 |
| Away | Innings | Runs | Average | 100s/50s |
|---|---|---|---|---|
| Brian Lara | 121 | 5736 | 47.80 | 17/22 |
| Vivian Richards | 115 | 5404 | 50.50 | 13/31 |
Contribution to wins
Richards has featured in a large number of wins while Lara was part of a team that lost almost twice the matches than it won. But the numbers show that Lara had bigger contributions to West Indian wins, averaging 61.
While the stats show that the match-winning quotient of Lara is higher, one has to account for the fact that Lara’s team depended more on him, a lot more than Richards’ team depended on him. That meant that West Indian teams involving Lara were more likely to win when he performed and vice-versa. It also shows that Lara had to play with greater pressure and burden on his shoulders compared to Richards.
Interestingly, while Richards averages 61 in drawn Test matches, Lara averages 71, showing that he played an important hand in games that West Indies probably ‘saved’.
| In Wins | Innings | Runs | Average | 100s/50s |
|---|---|---|---|---|
| Brian Lara | 52 | 2929 | 61.02 | 8/16 |
| Vivian Richards | 90 | 4300 | 52.43 | 12/22 |
Performance across innings numbers
A big indicator of the skill level and greatness of players is the ‘tough runs’ they’ve scored. It is almost universally accepted that runs in the second innings almost always matter more than runs in the first. Runs that come in the fourth innings of a match are way tougher than runs in the second innings, which is usually a great time to bat.
| First Innings | Innings | Runs | Average | 100s/50s |
|---|---|---|---|---|
| Brian Lara | 58 | 4000 | 70.17 | 12/12 |
| Vivian Richards | 48 | 2531 | 53.85 | 8/9 |
| Second Innings | Innings | Runs | Average | 100s/50s |
| Brian Lara | 72 | 4249 | 59.01 | 13/21 |
| Vivian Richards | 73 | 3514 | 48.8 | 10/21 |
| Third Innings | Innings | Runs | Average | 100s/50s |
| Brian Lara | 56 | 2264 | 40.42 | 7/8 |
| Vivian Richards | 37 | 1584 | 49.5 | 4/9 |
| Fourth Innings | Innings | Runs | Average | 100s/50s |
| Brian Lara | 46 | 1440 | 35.12 | 2/7 |
| Vivian Richards | 24 | 911 | 47.94 | 2/6 |
Once again, we can see how Richards, who was consistent home and away, is also consistent across various innings. It is an incredible stat, and very few players can match up to this kind of consistency: the difference between the first and fourth innings averages of Richards is just six runs.
For Lara, the first innings average is double of his fourth innings average. That is huge. It means Richards got a lot more tough runs than Lara. That said, Lara was more likely to influence the direction of a game when he got in first with big innings, where he averages 17 runs more than Richards.
Richards is the crisis man, the finisher who is likely to perform the same way independent of whether it is a fresh pitch, a good batting surface or a fifth day pitch that is breaking up. That says a lot about Richards’ character, almost corroborating everyone’s memory of his batting that started with a swagger, flowed with mighty swings and ended generally with humiliation for bowlers.
Performance as captain
However, anyone who would feel Richards performed better under pressure, has a googly coming their way.
| As captain | Innings | Runs | Average | 100s/50s |
|---|---|---|---|---|
| Brian Lara | 85 | 4685 | 57.83 | 14/19 |
| Vivian Richards | 74 | 3068 | 45.11 | 6/23 |
Lara was the better batsman of the two as a leader, by far. As captain, Lara averaged close to 58, which was more than 5 runs higher than his normal average. On the other hand, Richards’ average dropped by 5 runs when he batted as a captain.
Although Richards never lost a series, the great man was better with the willow as someone else’s lieutenant than being the captain of the ship. Lara also had a lot more significant scores as captain than Richards did.
Performance against different opposition
Now come the individual numbers. As we know, all great players have a favourite team. But once again, Richards shows he is the man for all seasons. Lara scored big numbers against some teams. Against the best team of his generation, Australia, Lara averages an impressive 51, higher than that of Richards.
However, the difference in Richards’ best average – against England – and worst – against Pakistan – is just 20 runs. For Lara, the difference is huge, 51. Lara never quite clicked against India, although he hammered the other two sub-continental teams.
We could offer a conjecture that Lara dealt better with Pakistan’s pacers as opposed to India’s spinners. However, that wouldn’t be objective enough.
This stat also indicates that Richards was equally successful against all kinds of attacks, while Lara had preferences.
| Brian Lara | Opponents | Innings | Runs | Average | 100s/50s |
| Australia | 58 | 2856 | 51 | 9/11 | |
| England | 51 | 2983 | 62.14 | 7/11 | |
| India | 29 | 1002 | 34.55 | 2/6 | |
| New Zealand | 17 | 704 | 41.41 | 1/5 | |
| Pakistan | 22 | 1173 | 53.31 | 4/3 | |
| South Africa | 35 | 1715 | 49 | 4/9 | |
| Sri Lanka | 14 | 1125 | 86.53 | 5/2 | |
| Vivian Richards | Opponents | Innings | Runs | Average | 100s/50s |
| Australia | 54 | 2266 | 44.43 | 5/14 | |
| England | 50 | 2869 | 62.36 | 8/15 | |
| India | 41 | 1927 | 50.71 | 8/7 | |
| New Zealand | 10 | 387 | 43 | 1/2 | |
| Pakistan | 27 | 1091 | 41.96 | 2/7 |
Both Lara and Richards were terrible in New Zealand, although Richards once again shows through his numbers that he was equally good on turning tracks, seaming pitches and bouncy surfaces – the hallmark of a great batsman. He reserved most of his wrath for England, and that has quite a bit to do with proving his place and that of West Indies in the face of some racism that he had to endure early in his career.
Performance in different countries
The beautiful pattern continues as Lara’s average wavers drastically and Richards’ remains amazingly consistent. Lara did well in Sri Lanka but not in India, an anomaly. He did well in England and even South Africa but not as well in Australia, again an anomaly.
Richards was a mercurial, moody player and the rest of the teams will be thankful that he never looked to dominate and decimate them as deliberately as he did against England.
| Brian Lara | Venue | Innings | Runs | Average | 100s/50s |
| Australia | 35 | 1469 | 41.97 | 4/4 | |
| England | 27 | 1268 | 48.76 | 4/6 | |
| India | 6 | 198 | 33 | 0/2 | |
| New Zealand | 11 | 406 | 36.9 | 1/3 | |
| Pakistan | 13 | 626 | 48.15 | 2/1 | |
| South Africa | 18 | 841 | 46.72 | 2/5 | |
| Sri Lanka | 7 | 706 | 100.85 | 3/1 | |
| Vivian Richards | Venue | Innings | Runs | Average | 100s/50s |
| Australia | 39 | 1760 | 47.56 | 4/11 | |
| England | 34 | 2057 | 64.28 | 5/12 | |
| India | 24 | 954 | 45.42 | 3/4 | |
| New Zealand | 4 | 77 | 19.25 | 0/0 | |
| Pakistan | 14 | 556 | 42.76 | 1/4 |
Not much comparison in ODIs
While Lara did score tons of runs in the shorter format too, Richards was easily the better ODI player, averaging 7 runs more per innings compared to Lara. And 47 is still an amazingly high average, even 25 years after his retirement. In ODIs, there is almost no comparison; Richards wins it hands-down.
He was way ahead of his time, the original Master Blaster, the ODI genius who knew how to play the shorter format. An electric fielder and a bowler with a golden arm, Richards had a strike-rate of 90.20 at a time when 70 was a brilliant number, while Lara hovered at 80 which was a decent strike-rate for his age.
| Overall | Innings | Runs | Average | Strike-rate | 100s/50s |
|---|---|---|---|---|---|
| Brian Lara | 289 | 10405 | 40.48 | 79.51 | 19/63 |
| Vivian Richards | 167 | 6721 | 47.00 | 90.20 | 11/45 |
Conclusion
The two charismatic batsmen, one a right-hander and another a left-hander, represented two different shades of greatness. Lara’s greatness lay in his ability to set the tone, dictate terms early and influence the outcome of games when he was in. He dominated early and had his favourites. When Lara was on song, he demolished anything.
Richards’ greatness lies in his consistency. He did well in every innings – from first to fourth. He played equally well home and away unlike Lara, who averaged higher at home and in the first innings. Richards was consistent against all teams unlike Lara, who had a brilliant record against some and bad against other.
Lara averaged 60, 51 and 41 at positions 3, 4 and 5 respectively, while Richards averaged 61, 41 and 47 in those same positions, showing both were dominating No. 3s. But Richards was also useful down the order unlike Lara, once again following the pattern. In other words, a combination of Lara and Richards is what every captain will ask for.
It’s too bad that West Indies got one just when the other was about to leave. What would the world have not given to watch Lara at No. 3 and Richards walking in at No. 4!
Brand-new app in a brand-new avatar! Download Cric Rocket for fast cricket scores, rocket flicks, super notifications and much more!
