
'%20x='0'%20y='0'%20height='100%25'%20width='100%25'%20%0A%20%20%20%20%20%20%20%20%20%20xlink%3Ahref='data:image/jpg;base64,/9j/2wBDAAYEBQYFBAYGBQYHBwYIChAKCgkJChQODwwQFxQYGBcUFhYaHSUfGhsjHBYWICwgIyYnKSopGR8tMC0oMCUoKSj/2wBDAQcHBwoIChMKChMoGhYaKCgoKCgoKCgoKCgoKCgoKCgoKCgoKCgoKCgoKCgoKCgoKCgoKCgoKCgoKCgoKCgoKCj/wgARCAAGAAoDASIAAhEBAxEB/8QAFQABAQAAAAAAAAAAAAAAAAAABAX/2gAIAQEAAAAAfA//xAAUAQEAAAAAAAAAAAAAAAAAAAAD/9oACAECEAAAAD//xAAUAQEAAAAAAAAAAAAAAAAAAAAC/9oACAEDEAAAAF//xAAkEAABAwIEBwAAAAAAAAAAAAACAQMEAAUGBxETEhUhIjFiov/aAAgBAQABPwB7DPMItravOIL9dYChuvw5UhNt0kLUS9fKJpT2VtvceM23eACJVEe/p9V//8QAFhEAAwAAAAAAAAAAAAAAAAAAAAMy/9oACAECAQE/AFSf/8QAFhEAAwAAAAAAAAAAAAAAAAAAAAIx/9oACAEDAQE/AGp//9k='%3E%3C/image%3E%3C/svg%3E)
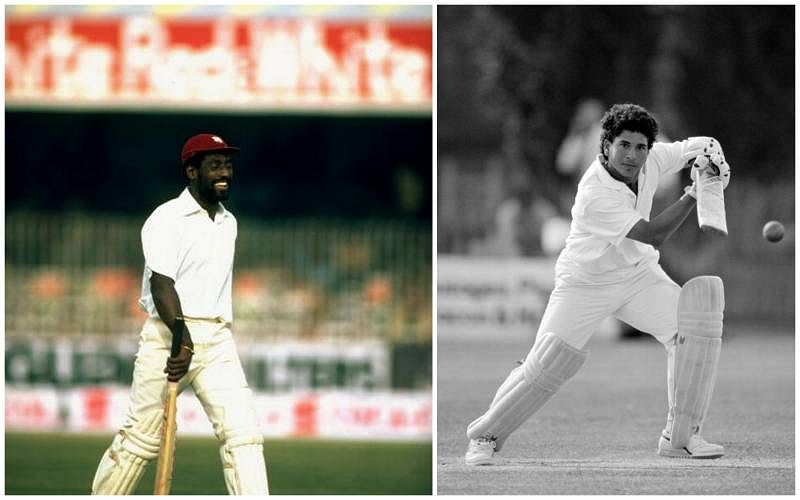
In a recent exercise by the Cricket Monthly, a panel of 50 expert players, commentators and writers voted Viv Richards as The Greatest ODI Cricketer of All Time. A closer look at Richards' batting average and strike-rate suggests that some stats hide more than they reveal.
The Richards aura was heady – one that some just can’t shrug off. But where does he rank in history compared to Sachin Tendulkar? We’re warned that these exercises offer ‘a sense of perspective. Do they?
We’re told that he swaggered. He stared. He even chewed gum. We’re reminded that ‘over a 16-year period he scored at more than 90 runs per hundred balls’. Did he?
We’ll have to deal elsewhere with ‘aura’, captaincy, World Cup, bowling, fielding heroics and the rest. But in this piece let’s look at batting average and strike-rate. Not surface stats but deeper. Surface stats are good fun over 5, 10 years. Bring ‘history’ in and perspective is vital. At least it should be.
Richards’ average was 47. But against a 3600-match ODI history, it is part myth: held over just 7,451 deliveries.
Sachin held his average of 45 over 21,367 deliveries. If Richards had faced as many deliveries, would his average have plummeted? Yes.
Who's batting average was more hard-earned?
After a punishing 18 years, Sachin’s average in his last 6 years was still in the 40s or higher. After a leisurely 11 years, Richards’ average in his last 6 years fell to the 20s and 30s.
Why leisurely? Of Richards’ 17 years, only 7 years (41%) saw him play 10+ ODIs a year.
Why punishing? Of Sachin’s 24 years, as many as 22 years (92%) saw him play 10+ ODIs a year.
Who was tested more? Who had the greater opportunity to fail – from injury, from fatigue, sheer range and depth of opposition, from intrusive umpiring, from pain, preoccupation?
Sachin was tested in 30+ ODIs a year in five years. Richards? Not a single year.
Yet for over half of Richards’ 17 years his average was below 35, ie: 9 years out of 17.
Only a fourth of Sachin’s 24 years saw his average below 35, ie: 6 years out of 24.
Only a third of Richards’ career saw his average at 45 or above, ie: 6 years out of 17.
For close to half of Sachin’s career his average was 45 or above, ie: 11 years out of 24.
Sachin’s average fell below 25 in only 2 years (only 8% of his career), Richards’ fell below 25 in 3 years (as much as 18% of his career).
Whose ‘high’ average was rare, whose routine?
The Viv Richards strike-rate myth
Richards’ strike-rate (90) too is part myth: held over a mere 187 matches.
Sachin’s strike-rate (86) is as real as it gets, sustained over an unprecedented 463 matches.
Richards’ strike-rate fell ‘below 80’ for as much as a third of his career (5 out of 17 years).
Sachin’s fell ‘below 80’ for only a fourth of his (6 out of 24 years) - after being tested 7 more years than Richards was.
Sachin’s strike-rate fell below 70 in only 2 years (only 8% of his career), Richards’ fell below 70 in 3 years (as much as 18% of his career).
Crucially, often the fewer deliveries Richards faced, bloated his strike-rate because of his run-flurry while, fleetingly, at the crease. But as strike-rate goes, fleeting isn’t good enough.
Richards faced 100+ deliveries in just 10 innings. Ten!
Sachin faced 100+ deliveries in as many as 68 innings.
Whose high strike-rate was exceptional, whose everyday?
Only 5 of Richards’ innings saw 130+ deliveries. Five!
As many as 29 Sachin innings saw 130+ deliveries.
In Albion in 1984 Richards’ strike-rate was 400 (4 off the lone delivery). These and other deceptive strike-rates pushed his career rate to a zone where it didn’t belong, encouraged by his meagre 187 ODIs compared to the average of 380 ODIs played by the Top 10 scorers.
A career figure is meant to be representative - of a career. Richards’ strike-rate wasn’t. Any more than Bradman’s average was.
A sense of perspective
In 1992 Sachin had a strike-rate of 69; same as Richards in 1978.
Richards faced just 13 deliveries in the lone match that year. Sachin faced 1,019 deliveries from 21 matches that same year.
Richards’ ‘stats were unreal’ – apparently, in more ways than one.
Sachin’s striking rate was more honest, never exceeding 200. They were more consistent (real?) and they’ve habitually come off more deliveries, to more truthfully be described as ‘runs per 100 deliveries’.
Was Richards’ ‘ability to improvise, thrive in a variety of conditions’ unique? Jayasuriya’s ‘get-out-of-here’ strike-rate of 91 was off about twice the number of deliveries that Richards faced.
Sachin’s long career wasn’t, as some believe, an edge over others. The longer you’re on the field the greater the chance of your stats sagging. Not because of your age but because of the sheer field combat you’ve weathered.
For every additional 30 deliveries faced, Sachin was tested. He ended up being tested in 3,300 deliveries more than the next man. Proud averages and strike rates that seem to rise above his, pale in comparison when tested – by more deliveries, more overs, more matches, more playing years.
Richards was special. He remains the greatest ODI player of his era.
But we’re discussing nearly 50 years of ODIs, aren’t we?
We’re told that ‘...more than half the jury’ voted for Richards and in a ‘pleasant’ surprise he ‘annihilated the competition’.
Pleasant or not, it’s a surprise. But whatever happened to ‘a sense of perspective’?
Rudolph Lambert Fernandez is the author of the non-fiction book ‘GREATER THAN BRADMAN’ www.greaterthanbradman.com
Brand-new app in a brand-new avatar! Download CricRocket for fast cricket scores, rocket flicks, super notifications and much more! 🚀☄️
