

'%20x='0'%20y='0'%20height='100%25'%20width='100%25'%20%0A%20%20%20%20%20%20%20%20%20%20xlink%3Ahref='data:image/jpg;base64,/9j/2wBDAAYEBQYFBAYGBQYHBwYIChAKCgkJChQODwwQFxQYGBcUFhYaHSUfGhsjHBYWICwgIyYnKSopGR8tMC0oMCUoKSj/2wBDAQcHBwoIChMKChMoGhYaKCgoKCgoKCgoKCgoKCgoKCgoKCgoKCgoKCgoKCgoKCgoKCgoKCgoKCgoKCgoKCgoKCj/wgARCAAHAAoDASIAAhEBAxEB/8QAFQABAQAAAAAAAAAAAAAAAAAAAgf/2gAIAQEAAAAAmY//xAAUAQEAAAAAAAAAAAAAAAAAAAAF/9oACAECEAAAACP/xAAUAQEAAAAAAAAAAAAAAAAAAAAB/9oACAEDEAAAAD//xAAiEAACAgEBCQAAAAAAAAAAAAABAgMEABIFBhYiQVFVlNL/2gAIAQEAAT8Avbo21qIIKDvPpVjG8ygg6ecBg/Q984R234dfZT6z/8QAGBEAAgMAAAAAAAAAAAAAAAAAAAEDFEH/2gAIAQIBAT8AvSLEf//EABcRAAMBAAAAAAAAAAAAAAAAAAABA1H/2gAIAQMBAT8ApV4f/9k='%3E%3C/image%3E%3C/svg%3E)
By design, football is actually a very simple sport.
The hardest part to understand, by popular opinion, is the offside rule, which takes a couple of days to sink in.
As compared to cricket or even American football, football has clearly laid out rules and effectively requires just the one ball to get a game going.
Even the statistics that revolve around football tend to be very simple in nature. The number of goals scored tells you how good a striker is and the number of clean sheets tells you how effective a goalkeeper and defence is.
Goal difference is essentially the difference between the number of goals you scored and the number of goals you conceded.
Same stands for the points system; 3 points if you win, 1 if you draw and none if you lose; very well crafted if you ask me.
The ultimate need of the point system in a league or a tournament is to show us, in a tabular format, which team lies where in the hierarchy of points.
In descending order, the team with the highest points leads the table, followed by the team with the second highest points, and so on and so forth.
If any two teams secure equal number of points at any given stage, they are separated by their goal difference or their goals scored, in that order of preference.
So essentially, a table at the end of the season will look like this:
This is the English Premier League Table for the 2012-2013 season.
(Click on image to enlarge)
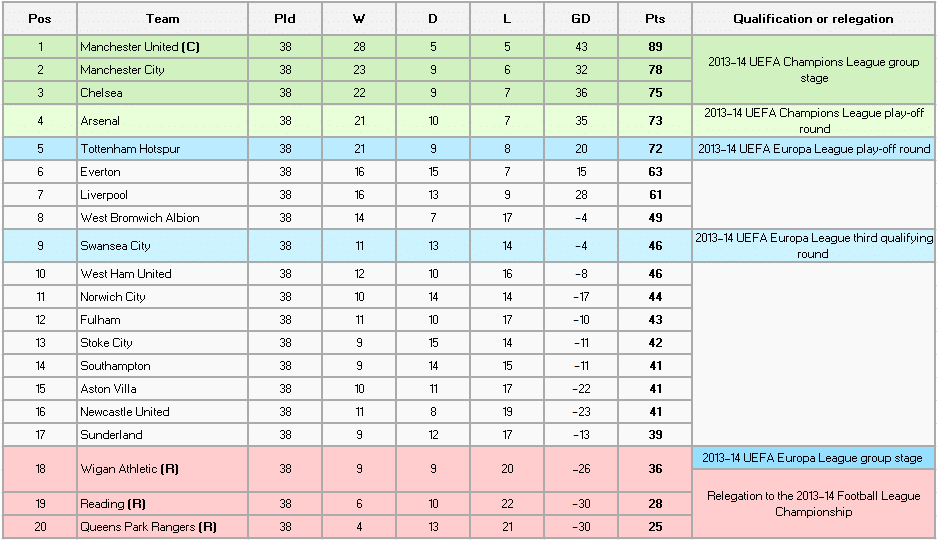
So, by looking at the aforementioned table, one can clearly infer that Manchester United won the contest by a comfortable lead, and the last three teams were resigned to relegation.
But it doesn’t clearly put in perspective the other dynamics at work. For instance, the three teams in a deadlock at 41 points, and how perilously close they could have been to relegation.
It also doesn’t clearly illustrate how the points for Manchester City at 2nd, right till Tottenham Hotspur at 5th, were unbelievably close to each other.
It also doesn’t help a reviewer appreciate the performance of a club over an entire season, polarizing the perspective on the top 4 spots, which promise a shot at the UEFA Champions League, or the 3 at the bottom, who will bite the dust.
The teams from 5 to 17 really evoke not many reactions from people who are used to this particular traditional view of the league table.
According to Forbes, this particular view of the table evolved once typical newspaper readers preferred their data in the form of a description, as opposed to puddles of raw data, leaving them to infer ideas by themselves.
It was also preferred due to the compact form, which conserved a lot of space, as opposed to the Cann Table, which is quite a lavish experiment.
The Cann table is called so after Jenny Cann, who invented it. An ardent supporter of Arsenal, she spent quite a lot of time advocating the advantages of the table, until her tragic death just before the end of the 2002/03 season.
Also called ‘The Visual League Table’, the Cann table is extremely simplistic in its presentation. Starting from the team on the top, the table charts its way to the bottom, and uses all the possible points in the way.
It lists every team adjacent to its respective points total, and wherever the total has no corresponding team, it is simply left blank. As an example, the Premier League Table of the current season is demonstrated in both forms on the next page.
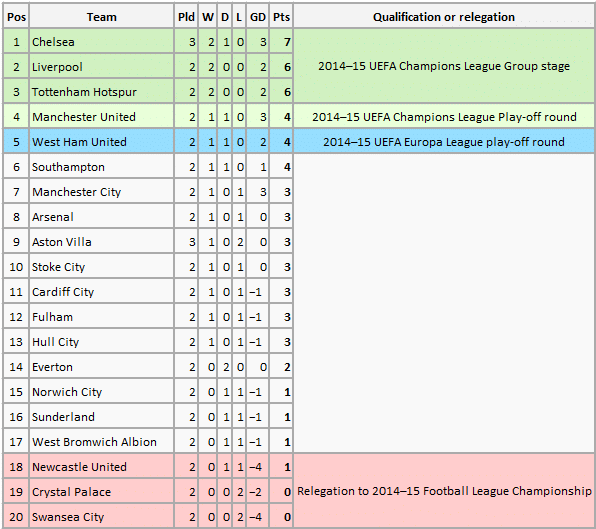
Traditional Table
(Click on image to enlarge)
The Cann Table
(Click on image to enlarge)
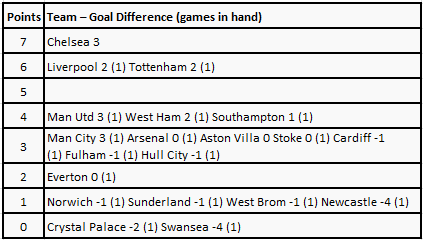
The points system is simple, which houses the corresponding team alongside it, with the goal difference. The number in the bracket is the number of games a team has to play to match the team with the most number of games played.
Similar to the concept of percentile, the clubs are judged with relation to the one with the highest tally of goals.
Next, the table is very easy to decipher, and it accurately positions a team, without actually ranking it.
So the teams, who have scored 3 points, are all bunched together, in spite of having varying goal difference. So the Cann table also helps eliminate, till an extent, parameters that are secondary in nature but cloud our judgment when it comes to rating a particular team.
But as a drawback, you cannot actually pick the third team in the relegation zone without straining to gather more data points.
Let’s go back to last season’s table presented in the form of a Cann table.
(Click on image to enlarge)
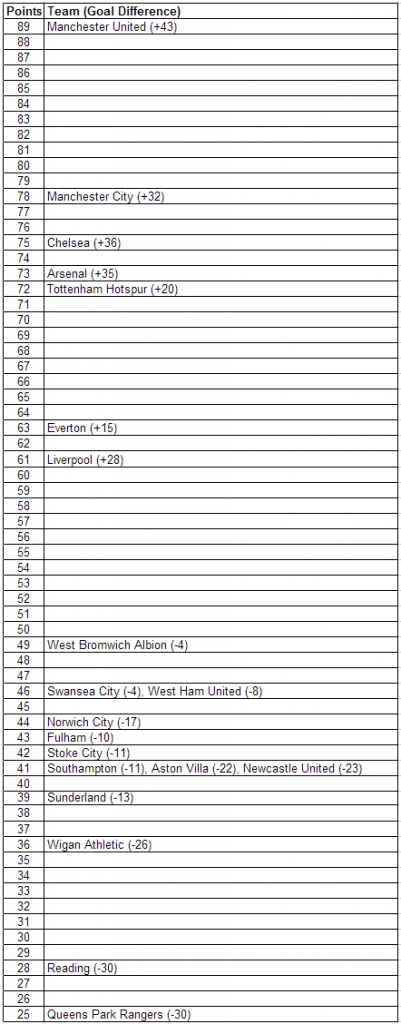
The table elucidates how Arsenal and Tottenham are too close for comfort, but Chelsea and Manchester City too are clumped in the range of 7 points, both ends inclusive.
It also demonstrates the huge difference between Tottenham and Everton, at positions 5 and 6 respectively.
It illustrates how teams are placed, but it also lays emphasis on how far apart they lie in terms of points, actually helping the reader visualize with numerical chasms.
With simple logic and shedding comparatively verbose data, the Cann table showcases a better way to understand the league with relative data.
It has its fair share of criticism, most of which revolve around the inclusion of the probability of random events, or even luck, but overall, the Cann table does quite a good job at being simple and making it extremely easy for a user to follow a team’s progress over the course of a season.
