
'%20x='0'%20y='0'%20height='100%25'%20width='100%25'%20%0A%20%20%20%20%20%20%20%20%20%20xlink%3Ahref='data:image/jpg;base64,/9j/2wBDAAYEBQYFBAYGBQYHBwYIChAKCgkJChQODwwQFxQYGBcUFhYaHSUfGhsjHBYWICwgIyYnKSopGR8tMC0oMCUoKSj/2wBDAQcHBwoIChMKChMoGhYaKCgoKCgoKCgoKCgoKCgoKCgoKCgoKCgoKCgoKCgoKCgoKCgoKCgoKCgoKCgoKCgoKCj/wgARCAAGAAoDASIAAhEBAxEB/8QAFQABAQAAAAAAAAAAAAAAAAAABAb/2gAIAQEAAAAAjh//xAAUAQEAAAAAAAAAAAAAAAAAAAAC/9oACAECEAAAAB//xAAUAQEAAAAAAAAAAAAAAAAAAAAB/9oACAEDEAAAAD//xAAjEAACAQIEBwAAAAAAAAAAAAADBAIBEgAGEzEFESEjMpGh/9oACAEBAAE/AJZcnLipXW2StDUYGaoZmr3+njKXLa75hjJ79WC6LSsB3Vtjp7U9Y//EABcRAAMBAAAAAAAAAAAAAAAAAAACAyH/2gAIAQIBAT8AXKH/xAAXEQADAQAAAAAAAAAAAAAAAAAAAQMR/9oACAEDAQE/ALvD/9k='%3E%3C/image%3E%3C/svg%3E)
Henry Clay once said, “Statistics are no substitute for judgments”.
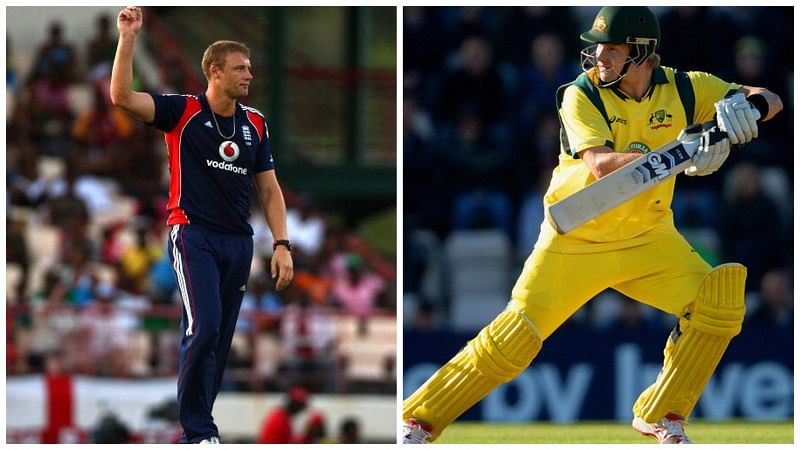
Even though players, or any individual for that matter, cannot be brought down to mere statistics, we set out to compare the stats of two of the most fearsome all-rounders of 21st century to get a better grasp of their careers.
Before we start with the comparision, it is important to bear in mind that both of them had slightly different roles and responsibilities, Freddie being a bowling all-rounder for England and Watto being a star batting all-rounder for Australia. While Flintoff batted lower down the order, Watson floated up and down the order throughout his career, and even opened for Australia a few times. Both the players were immensely talented, but their careers were seriosuly affected/ cut short by injuries.
Here’s a look at their career stats.
| Player | Matches (Innings) | Runs | HS | Average | 100s/50s |
|---|---|---|---|---|---|
| Andrew Flintoff | 79 (130) | 3845 | 167 | 31.77 | 5/26 |
| Shane Watson | 59 (109) | 3731 | 176 | 35.19 | 4/24 |
| Player | Matches (Innings) | Wickets | Runs | BBI | Economy |
|---|---|---|---|---|---|
| Andrew Flintoff | 79 (137) | 226 | 7410 | 5/58 | 2.96
|
| Shane Watson | 59 (93) | 75 | 2526 | 6/33 | 2.75 |
| Player | Matches (Innings) | Runs | HS | Average | 100s/50s |
| Andrew Flintoff | 141(130) | 3394 | 167 | 32.77 | 3/18 |
| Shane Watson | 190 (169) | 5757 | 185* | 40.54 | 9/33 |
In the batting department, Watson clearly stands out with more runs, and more centuries. Though he’s played more matches, his average is much better, also due the fact that he has 27 not outs in ODIs.
| Team | Matches (Innings) | Runs | HS | 100/50 |
|---|---|---|---|---|
| Bangladesh | 9 (5) | 350 | 185* | 1/1 |
| England | 43 (40) | 1306 | 161* | 3/5 |
| India | 19 (19) | 717 | 102 | 1/4 |
| New Zealand | 18 (16) | 552 | 105* | 1/4 |
| Pakistan | 21 (17) | 569 | 116* | 1/3 |
| South Africa | 16 (15) | 333 | 82 | 0/1 |
| Sri Lanka | 21 (19) | 517 | 69 | 0/4 |
| West Indies | 26 (24) | 853 | 125 | 126 |
| Team | Matches (Innings) | Runs | HS | 100/50 |
| Bangladesh | 8 (6) | 239 | 70* | 0/3 |
| Australia | 21 (19) | 519 | 87 | 0/1 |
| India | 19 (19) | 708 | 99 | 0/4 |
| New Zealand | 11 (11) | 277 | 106 | 1/1 |
| Pakistan | 14 (14) | 443 | 84 | 0/3 |
| South Africa | 12 (10) | 321 | 78* | 0/3 |
| Sri Lanka | 10 (9) | 222 | 104 | 1/1 |
| West Indies | 15 (12) | 313 | 123 | 1/1 |
Shane Watson’s best batting performance is agaisnt arch-rival England, while his English counterpart has had the best record against India. The Australian all-rounder has a better batting record, with more runs against all the major teams.
| Player | Matches (Innings) | Wickets | Runs | BBI | Economy |
|---|---|---|---|---|---|
| Andrew Flintoff | 141 (119) | 169 | 7410 | 5/19 | 4.39
|
| Shane Watson | 190 (163) | 168 | 5342 | 4/36 | 4.95 |
Even here, the difference between the wickets is marginal, but Flintoff has a slightly better economy rate.
| Batting | Bowling |
|---|
| Player | Matches (Innings) | Runs | HS | Overs | Wickets |
|---|---|---|---|---|---|
| Andrew Flintoff | 14 (17) | 856 | 102 | 459.5 | 43 |
| Shane Watson | 14 (27) | 1069 | 103 | 144.4 | 7 |
The oldest rivalry in cricket has been between Australia and England, and if there is one series that cricket fans from both these countries await with bated breath, then it’s the Ashes.
Andrew Flintoff owes much of his success to the Ashes series of 2005- a series that transformed him into an Ashes legend of sorts. Flintoff was England’s saviour in the series and ended up being the highest wicket taker and third highest run-getter. He was crowned as the “BBC Sports Personality of the Year 2005” – the first cricketer since Ian Botham.
One of the most poignant Ashes moments remain Flintoff’s image trying to console a dejected Brett Lee. After Flintoff announced his retirement in 2010 due to an injury, Brett Lee had described him as an “absolute beauty”.
For a very long time, Shane Watson was termed as Australia’s response to Flintoff in Ashes, but somehow his occasional brilliances in batting couldn’t translate into consistent all-round performances. It was in the 2009 Ashes series that Watson first got to open for Australia- a strategy that clicked temporarily.
| Player | Matches | Runs | 100s/50s | Wickets |
|---|---|---|---|---|
| Andrew Flintoff | 14 | 642 | 0/6 | 46 |
| Shane Watson | 12 | 627 | 1/3 | 19 |
Visiting teams often have a difficult time playing on the flat subcontinental pitches in humid conditions.
While Watson has scored 540 runs in India, and 87 in Sri Lanka, Freddie played in India, Sri Lanka and Pakistan, scoring 374, 143 and 125 runs in each respectively. Since both Watson anf Freddie are right-arm fast bowlers, they faced similar problems on the spin-friendly Indian tracks, but the English all-rounder clearly leads in the bowling department by a big margin.
Final Verdict
Like George Canning said, “I can prove anything with statistics, but truth.” Judging a sportsperson solely by his/her statistics would be unfair. But it is also true, that statistics in sports cannot really be manipulated easily, and therefore provide a clear picture.
What the stats reveal corresponds to the fact that both Watto and Freddie had different roles to play. While Watson was a better batsman, Flintoff showed better skills with the ball, along with being the undoubted Ashes hero.
Flintoff had retired from all the formats in 2010, owing to an injury, and since then he has turned to professional boxing, alongside making frequent appearances in reality shows.
Watson was the star batsman for Australia for a while, but an injury-plagued career kept bogging him down, and caused a prolonged dip in form. He announced his retirement from Test cricket after the 2015 Ashes series, following a dismal performance.
Brand-new app in a brand-new avatar! Download CricRocket for fast cricket scores, rocket flicks, super notifications and much more! 🚀☄️
