

'%20x='0'%20y='0'%20height='100%25'%20width='100%25'%20xlink%3Ahref='data:image/jpg;base64,/9j/2wBDAAYEBQYFBAYGBQYHBwYIChAKCgkJChQODwwQFxQYGBcUFhYaHSUfGhsjHBYWICwgIyYnKSopGR8tMC0oMCUoKSj/2wBDAQcHBwoIChMKChMoGhYaKCgoKCgoKCgoKCgoKCgoKCgoKCgoKCgoKCgoKCgoKCgoKCgoKCgoKCgoKCgoKCgoKCj/wgARCAAGAAoDASIAAhEBAxEB/8QAFgABAQEAAAAAAAAAAAAAAAAAAAYH/8QAFQEBAQAAAAAAAAAAAAAAAAAABAX/2gAMAwEAAhADEAAAAMdvAd3/xAAhEAACAQMDBQAAAAAAAAAAAAABAwIABBEFBhIIEyFR0v/aAAgBAQABPwDa7o3sLazuVcw9kV8+5IYyfQp/TpuMuYV6powhnxks+K//xAAXEQEAAwAAAAAAAAAAAAAAAAABAAIh/9oACAECAQE/AKus/8QAGREAAgMBAAAAAAAAAAAAAAAAAQIABCJB/9oACAEDAQE/ALWEQA8n/9k='%3E%3C/image%3E%3C/svg%3E)
In the game of cricket, there are two fundamental types of bowling: fast and spin bowling. While fast bowlers rely on a combination of speed and movement in the air to get the better of batsmen, spin bowlers use the flight and guile and rely on turn off the pitch to deceive batsmen.Having bowlers of both types in a team is of absolute necessity in order to be successful, as the variety that they offer makes it that much more difficult for batsmen to negotiate. With pitches around the world all behaving differently from each other, having a balanced attack ensures that you are prepared for all possibilities in regards to the playing surface.As far as comparing pace and spin bowling is concerned, there has been an interesting change over the last 2-3 decades. The presence of the likes of Dennis Lillee, Imran Khan and the fearsome pace quartet from West Indies meant that pace bowlers ruled the roost in the 1970s and 80s. The entry of Shane Warne and Muttiah Muralitharan at the start of the 1990s, you could argue, made the next decade and more very much their era.With that being the case, below is a statistical comparison of pace v spin bowling over the last 5 years across all the three formats of the game to ascertain in whose favour the balance has tilted towards in recent times, if at all.
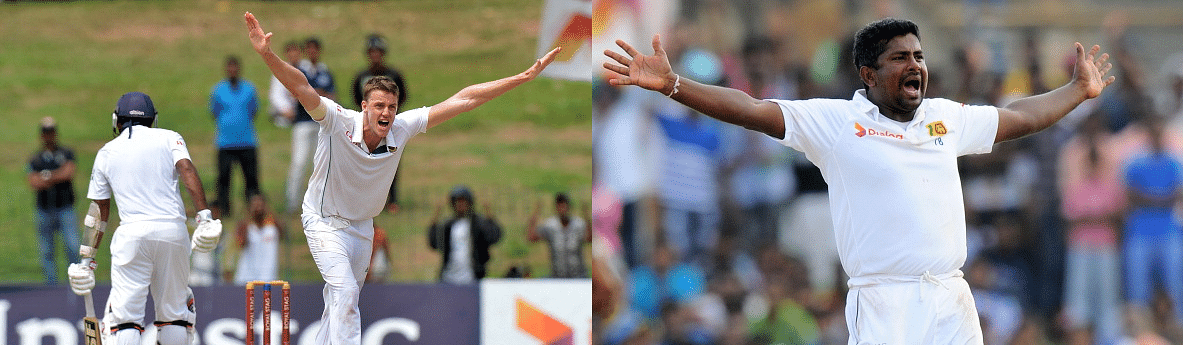
#1 Test cricket

Fast bowlers have taken approximately 1500 more wickets than spinners in the 206 Tests that have been played over the last 5 years, which is expected considering the fact that a side, in general, consists of 3 fast bowlers as opposed to just a single spinner.
While fast bowlers have an average and strike-rate of 32.55 and 61.5 respectively, spinners have an average and strike-rate of 36.46 and 73.1 respectively, by which we can safely conclude that the slower bowlers concede a few more runs and also take a bit longer to strike, in terms of number of deliveries, than fast bowlers.
| Type | Matches | Overs | Wickets | Average | Strike-rate | BBI | BBM |
| Pace | 206 | 40840.5 | 3982 | 32.55 | 61.5 | 7/29 | 12/127 |
| Spin | 206 | 28608.0 | 2345 | 36.46 | 73.1 | 9/127 | 14/184 |
#2 Tests in subcontinent
The Test records in the last 5 years illustrate that fast bowlers have fared slightly better than spinners, but the equation turns the other way round when you take into account Test matches to have been held in the subcontinent alone. Pitches in the subcontinent offer little assistance to fast bowlers as a result of which they are expected to play a largely holding role, with the responsibility of taking wickets falling on the spinners by and large. The stats might not show a massive difference between the strike-rates of pace bowlers and spinners, but that is only because of the difficulty spinners have in taking wickets quickly in comparison to fast bowlers.
| Type | Matches | Overs | Wickets | Average | Strike-rate | BBI | BBM |
| Pace | 74 | 11019.0 | 906 | 39.89 | 72.9 | 7/51 | 10/108 |
| Spin | 74 | 15145.1 | 1259 | 35.45 | 72.1 | 9/127 | 14/184 |
#3 Tests outside subcontinent
Conversely, pace bowlers hold the edge in Test matches held outside the subcontinent. While 3076 wickets have been taken by quick bowlers, spin bowlers have taken a relatively meagre 1086 wickets from the 132 Tests that have been played during the 5-year period. Fast bowlers also enjoy a much superior strike-rate of 58.1 as compared to the strike-rate of 74.3 of spinners. Most of these 132 Tests have been held in countries like Australia, England and South Africa, which offer very little by way of help to spin bowlers.
| Type | Matches | Overs | Wickets | Average | Strike-rate | BBI | BBM |
| Pace | 132 | 29821.5 | 3076 | 30.39 | 58.1 | 7/29 | 12/127 |
| Spin | 132 | 13462.5 | 1086 | 37.63 | 74.3 | 7/95 | 11/111 |
#4 ODI cricket
In ODI cricket, fast bowlers have effected 5570 dismissals whereas spinners have taken just 3005 wickets, but once again it doesn’t tell us much because fast bowlers have bowled almost 12000 overs more than spinners. They, just like in Test matches, also enjoy a better average and strike-rate than spinners. But, in ODI cricket, main priority is given to containing runs and spin bowlers have fared better than fast bowlers on this count. While quicks have conceded 5.17 runs per over, spinners have a much better economy rate of 4.66 runs per over.
| Type | Matches | Overs | Wickets | Economy | Average | Strike-rate |
| Pace | 644 | 33747.5 | 5570 | 5.17 | 31.36 | 36.3 |
| Spin | 644 | 22151.2 | 3305 | 4.66 | 34.36 | 44.2 |
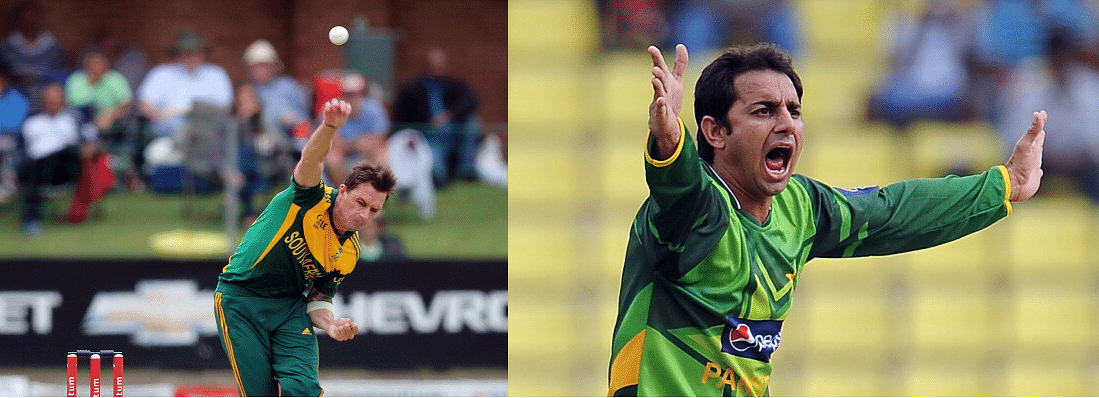
#5 T20 cricket

When T20 cricket initially began, many pundits feared that spin bowlers would be able to make absolutely no impact in the shortest format; however, they have been emphatically proved wrong on that front by spinners, who have shown tremendous skill in being able to adapt to T20 cricket. In fact, spinners have not just survived but actually outperformed fast bowlers in the format, so much so that it is now commonplace for captains to entrust spinners with the responsbility of bowling the death overs of a T20 innings.
While fast bowlers are conceding 7.73 runs an over in T20 internationals, spinners have an economy rate of 6.87 which is absolutely brilliant by T20 standards.
| Type | Matches | Overs | Wickets | Economy | Average | Strike-rate |
| Pace | 283 | 6159.4 | 1937 | 7.73 | 24.60 | 19 |
| Spin | 283 | 4266.2 | 1245 | 6.87 | 23.56 | 20.5 |

Looking for fast live cricket scores? Download CricRocket and get fast score updates, top-notch commentary in-depth match stats & much more! 🚀☄️