
'%20x='0'%20y='0'%20height='100%25'%20width='100%25'%20%0A%20%20%20%20%20%20%20%20%20%20xlink%3Ahref='data:image/jpg;base64,/9j/2wBDAAYEBQYFBAYGBQYHBwYIChAKCgkJChQODwwQFxQYGBcUFhYaHSUfGhsjHBYWICwgIyYnKSopGR8tMC0oMCUoKSj/2wBDAQcHBwoIChMKChMoGhYaKCgoKCgoKCgoKCgoKCgoKCgoKCgoKCgoKCgoKCgoKCgoKCgoKCgoKCgoKCgoKCgoKCj/wgARCAADAAoDASIAAhEBAxEB/8QAFgABAQEAAAAAAAAAAAAAAAAAAAQI/8QAFAEBAAAAAAAAAAAAAAAAAAAAAv/aAAwDAQACEAMQAAAA0VQEf//EAB8QAAIBAgcAAAAAAAAAAAAAAAEDAAIjBBETQUJRkv/aAAgBAQABPwBeHTo0Wl78R3AhOQtL8if/xAAWEQADAAAAAAAAAAAAAAAAAAAAARH/2gAIAQIBAT8AiP/EABYRAAMAAAAAAAAAAAAAAAAAAAABEf/aAAgBAwEBPwCI/9k='%3E%3C/image%3E%3C/svg%3E)
Western Australia took on Tasmania in the final of the Sheffield Shield 2023-24 at the Western Australia Cricket Association Ground in Perth. Tasmania elected to bowl after winning the toss.
Western Australia scored 347 runs in the first innings. Sam Whiteman scored 104 runs off 154 deliveries and was the highest run-scorer for the team.
Tasmania were bundled out for 186 runs in their first innings. Western Australia scored 376 runs in the second innings. Tasmania required to chase the target of 538 runs to win but they were bundled out for 160. Western Australia won the match by 377 runs. Whiteman won the Player of the Match award.
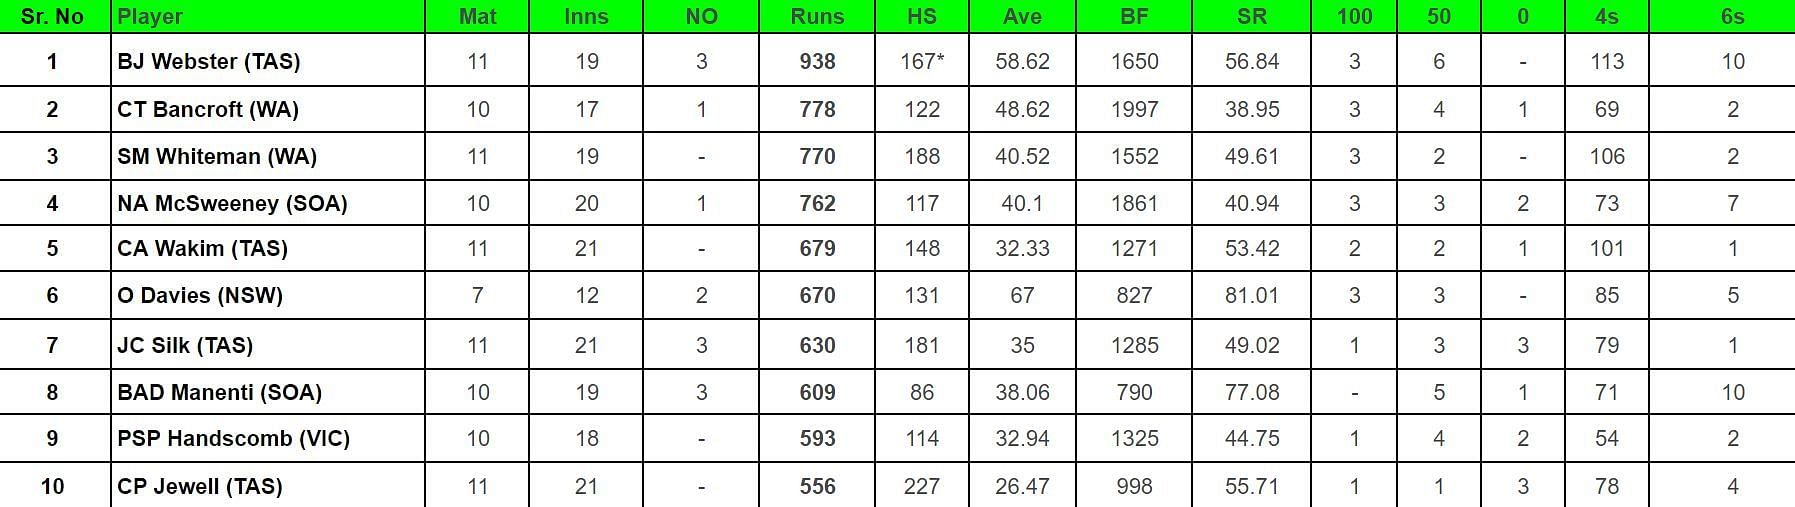
Sheffield Shield 2023-24 Most Runs List
Beau Webster finished as the leading run-scorer this season. He amassed a total of 938 runs in 11 matches at an average of 58.62.
Cameron Bancroft remained in second place and scored 778 runs in 10 matches at an average of 48.62.
Sam Whiteman jumped to third place from fifth. He scored 770 runs in 19 innings at an average of 40.52.
Nathan McSweeney moved to fourth position from third and made 762 runs in 20 innings at an average of 40.1.
Charlie Wakim jumped to fifth place from sixth and had 679 runs to his name in 11 matches at an average of 32.33.
Sheffield Shield 2023-24 Most Wickets List
Chris Tremain finished in first place on this list of the bowlers with the most wickets. He took 50 wickets in 10 matches at an average of 15.9.
Nathan McAndrew took 48 wickets in nine matches at an average of 18.58 and remained in second place.
Corey Rocchiccioli jumped to third place from fifth and finished with 46 wickets in 11 matches at an average of 27.6.
Gabe Bell remained in fourth position and took 42 wickets in nine matches at an average of 19.9.
Fergus O'Neill took 40 wickets in nine matches and slipped to fifth place from third.
Cameron Gannon was the most successful bowler in the final and finished in the 13th position with 28 wickets in six matches at an average of 18.67.
Brand-new app in a brand-new avatar! Download CricRocket for fast cricket scores, rocket flicks, super notifications and much more! 🚀☄️
