'%20x='0'%20y='0'%20height='100%25'%20width='100%25'%20%0A%20%20%20%20%20%20%20%20%20%20xlink%3Ahref='data:image/jpg;base64,/9j/2wBDAAYEBQYFBAYGBQYHBwYIChAKCgkJChQODwwQFxQYGBcUFhYaHSUfGhsjHBYWICwgIyYnKSopGR8tMC0oMCUoKSj/2wBDAQcHBwoIChMKChMoGhYaKCgoKCgoKCgoKCgoKCgoKCgoKCgoKCgoKCgoKCgoKCgoKCgoKCgoKCgoKCgoKCgoKCj/wgARCAAGAAoDASIAAhEBAxEB/8QAFQABAQAAAAAAAAAAAAAAAAAABgf/2gAIAQEAAAAAryT/xAAUAQEAAAAAAAAAAAAAAAAAAAAD/9oACAECEAAAAA//xAAUAQEAAAAAAAAAAAAAAAAAAAAF/9oACAEDEAAAAGf/xAAfEAACAgEEAwAAAAAAAAAAAAABAwIEBQAGESESFHP/2gAIAQEAAT8A9HMKa8iV15DGeEm7icDEEkADhHQ7B1R2zbsUq7p5HLwmxcZmIzLSASPnr//EABYRAQEBAAAAAAAAAAAAAAAAAAECAP/aAAgBAgEBPwCLV3//xAAYEQEAAwEAAAAAAAAAAAAAAAACAAEEA//aAAgBAwEBPwDXl5AGzU//2Q=='%3E%3C/image%3E%3C/svg%3E)
Considering the latest agreement on new rules by the top clubs of England, the Premier League wage Vs. Position table is particularly eye catching. The idea behind the graph is to understand that wage and transfer fee is either key to success or to the lack of it, which is the current notion slowly creeping into the workings of the game; like the book ‘Soccernomics’ denoted, ‘it is the best paid teams that usually win their leagues’.
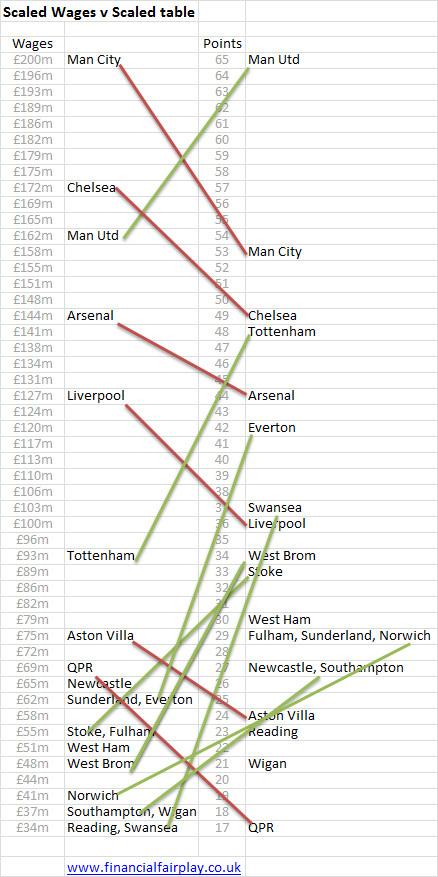
financialfairplay.co.uk have come up with a brilliant graph to show the relation between the two.
“The right two columns represent the current league table drawn to scale. The wage costs (shown in the two left columns) are based on either, recently published wage costs for the 2011/12 season, or, where not available, an estimate of the wage bill.”, explains Ed Thompson of financialfairplay.co.uk.
It is easy to figure out the reason for Manchester City’s failure to impress this season. It is also easy to wonder why Chelsea isn’t at Manchester United‘s throat at the top of the Premier League table. The graph goes on to explain the pressured jobs at Arsenal, Aston Villa and Liverpool, and the well-to-do state of Spurs, Everton, West Brom and Stoke.