
'%20x='0'%20y='0'%20height='100%25'%20width='100%25'%20xlink%3Ahref='data:image/jpg;base64,/9j/2wBDAAYEBQYFBAYGBQYHBwYIChAKCgkJChQODwwQFxQYGBcUFhYaHSUfGhsjHBYWICwgIyYnKSopGR8tMC0oMCUoKSj/2wBDAQcHBwoIChMKChMoGhYaKCgoKCgoKCgoKCgoKCgoKCgoKCgoKCgoKCgoKCgoKCgoKCgoKCgoKCgoKCgoKCgoKCj/wgARCAAGAAoDASIAAhEBAxEB/8QAFgABAQEAAAAAAAAAAAAAAAAAAAYH/8QAFQEBAQAAAAAAAAAAAAAAAAAABAX/2gAMAwEAAhADEAAAAMdvAd3/xAAhEAACAQMDBQAAAAAAAAAAAAABAwIABBEFBhIIEyFR0v/aAAgBAQABPwDa7o3sLazuVcw9kV8+5IYyfQp/TpuMuYV6powhnxks+K//xAAXEQEAAwAAAAAAAAAAAAAAAAABAAIh/9oACAECAQE/AKus/8QAGREAAgMBAAAAAAAAAAAAAAAAAQIABCJB/9oACAEDAQE/ALWEQA8n/9k='%3E%3C/image%3E%3C/svg%3E)
 (The following post is in no way intended to demean any player or his achievements. Its just an attempt to rack up the cricketing grey matter a bit)
A few days back was watching the last of the Rocky sequel – Rocky Balboa. While I loved watching one of my favourite childhood character Sylvester Stallone even with a crumpled body and a accent that defines how the Italics option in MSWord was innovated, there was one particular scene that appealed to me a lot. In the movie it is shown that experts use computer based stats and analysis to recreate an animation version of the yesteryear heavy weight champion Rocky Balboa v/s the current champion. Couldn’t help to find the similarity when people try to compare cricketing legends of the past and present.
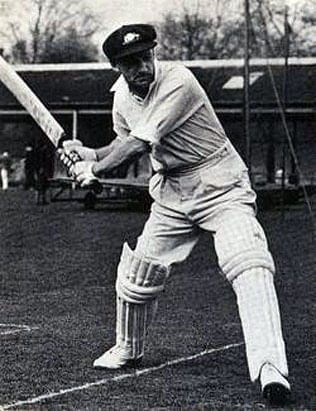
But one cricketing legend who never appears in any comparison for obvious reasons is Sir Donald Bradman. A Test average of 99.94 and domestic average of just over 100 proves why. But was he really as good as he is made out to be? Would he have scored the with the same average if he was playing in the modern age? All such questions prompted me to do a bit of research and scratch the my brain a bit. To re-iterate what I mentioned at the start no doubting that the man was a pure genius and I am not a Stats guru nor a mathematical wizard. What has gone into this analysis is pure cricketing logic and here is what I managed to come up with
Cricketing Era
To start with we need to clearly define the different era’s of cricket which may help us with the correction factors. All these years of cricketing evolution can be divided based on various parameters like Decade based differentiation (e.g. 1920-1929, 1930-1939, etc.), Condition wise differentiation (e.g. Covered/Uncovered pitches), Differentiation based on various teams getting test status so on and so forth. Since each of them has so many pros n con’s associated with them there was a lot of confusion regarding which 1 to follow. But than I came across this piece of statistic that baffled me completely
Rank Batsman Tests Innings Runs Highest Avg Career
1 D.G. Bradman 52 80 6996 334 99.94 1928–19482 IJL Trott 18 30 1600 226 61.73 2009–*3 R.G. Pollock 23 41 2256 274 60.97 1963–19704 G.A. Headley 22 40 2190 270* 60.83 1930–19545 H. Sutcliffe 54 84 4555 194 60.73 1924–19356 E. Paynter 20 31 1540 243 59.23 1931–19397 K.F. Barrington 82 131 6806 256 58.67 1955–19688 E.D. Weekes 48 81 4455 207 58.61 1948–19589 W.R. Hammond 85 140 7249 336* 58.45 1927–194710 G.S. Sobers 93 160 8032 365* 57.78 1954–1974
This is a list of the top 10 batting averages in tests. Have a look at the career date and the striking difference is that 8 out of the 10 batsman have a career span that ends before 1970. If we look at the history of cricket a bit more closely we find that the 1st ODI was played in 1971 and it picked up from there on. Coming back to our list we ignore Trott who has less than 2000 career runs that leaves us only with Sir Gary Sobers who has played only 1 ODI. This stats clearly shouts out the impact ODI’s have had and thats exactly the reason why I have decided to differentiate the era’s as Pre-ODI and Post-ODI.
What may be the factors that ODI’s have on tests match averages. The obvious one which comes to the mind is in the Post-ODI era batsman had to continuously change their batting style to suit the Test’s and the ODI’s. Now with the T20 coming up, 10-20 years down the line that too may have an impact on both forms of the game. Experts will agree that switching continuously between the 2 forms of the game (Test and ODI’s) can have an impact on not only the batting style but also the overall temperament. Playing in the V, Straight batted shots and a solid defence were the order of the day then. While all these still form the foundation of batting, a batsman needs to have a lot more stuff in his arsenal if he wants to succeed and that modifies his batting style continuously.
Coming to Bradman, he never had to switch between the 2 forms.(How much would he have averaged in ODI’s is a different topic altogether)
The next big impact ODI’s had, was that the rising popularity of the ODI’s made teams have lesser and lesser number of test matches in a series.So while earlier 5-6 test match series were common that got reduced to 3 match series or even a 1 off test in a series. A series that is 5-6 matches old gives the batsman a better chance get used to a bowling attack and make a comeback if he has had a low score in 1-2 matches. Also the fact is that the bowlers can be a bit on the fatigued side in long test series.
The 3rd major impact ODI’s had was bowlers started learning and developing newer and better variations like reverse swing, slower ball, off/leg cutters, the slower one bouncer being the latest 1. Though Bradman had to face the likes of Larwood and Bill Voce (Bodyline fame) I doubt if bowlers around the world had the amount of variations bowlers have recently.
External Conditions
This includes all the condition related to cricket including Weather, Pitch, Fatigue, etc. Now there are 3 aspects to this 1 hugely in favour of Bradman and 1 a bit against him.
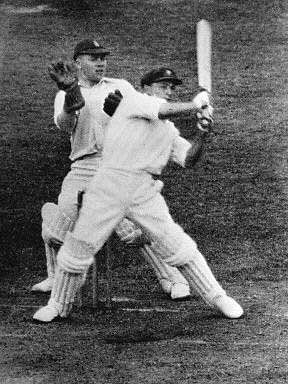
The factor that favours him mostly is that he played on uncovered pitches without helmets to some fearsome fast bowling.Even in the infamous Bodyline series(something was designed specially for him) he scored at an average of about 56. In the modern era we have seen the help that a bowler gets when there is play just after rain or early morning dew. All this with pitches completely covered through the night. Imagine the case on uncovered pitches. So regarding this aspect Bradman deserves loads of accolades
A look at a break up of his performance against all countries brings forth an interesting piece of information.
Opposition Matches Runs Avg Highest 100 / 50
England 37 5028 89.78 334 19/12India 5 715 178.75 201 4/1South Africa 5 806 201.50 299* 4/0West Indies 5 447 74.50 223 2/0
Overall 52 6996 99.94 334 29/13
As expected he played most of his cricket against England. Though his record against India, SA and West Indies is impressive he has played only 1 series against each of them. Ideally a players record against any country should be judged after he plays a home and away series with the same opposition. That clearly hasn’t happened. Secondly what I feel hasn’t been tested is his play against quality spin on spinner friendly wickets in the subcontinent.The only series that he played against India was a home series. Since we ha vent seen him bat against spin this cannot be considered as a major factor against him but its 1 aspect that cannot be ignored. Add to it the fact that he wasn’t tested to play in physically demanding conditions like West Indies, India and Sri Lanka.
Bradmans career span was abt 20 years out of which we can leave out about 6 years of the war. That leaves us with abt 13-14 years and 52 matches in that period. Which means only 4-5 Tests per year. He also played about 230 odd first class matches in about 22 years. These included 3,4,5,6 day matches. So overall if we compare it to the amount of cricket one needs to play and the fatigue(both mental any physical) one has to go through Bradman clearly had the advantage there. The other issue that experts often debate when it comes to Bradman is that since he played so many less matches and also lost about 6-7 years in the war he may have evaded the law of averages for the better. But we cannot consider what cannot be proved so we leave it there. Here’s a small story regarding Bradman’s view on law of averages for a quick read below.
“Once Bradman declined an invitation to dinner from Neville Cardus, telling the journalist that he wanted an early night because the team needed him to make a double century the next day. Cardus pointed out that his previous innings on the ground was 334, and the law of averages was against another such score. Bradman told Cardus, “I don’t believe in the law of averages”.In the event, Bradman batted all of the second day and into the third, putting on a world record partnership of 388 with Bill Ponsford.When he was finally out for 304 (473 balls, 43 fours and 2 sixes), Australia had a lead of 350 runs, but rain prevented them from forcing a victory.”
Enhancement in Technology
Nowadays we see each team has a bunch of technical guys sitting with the coach analyzing each opposition players strengths and weakness. This wasn’t the case back then and most of the captains and bowlers had to devise a strategy based on past experiences and experts opinions. When Bradman was just new to the Test world 1 of the experts claimed to have studied him and pointed out that he can be a bit susceptible to incoming deliveries on his pads. The English bowlers decided to try it out and the way Bradman responded was by scoring 60-70% of his runs in the region between midwicket and fineleg. So we can just imagine how reliable experts opion were at that time.
While 1 can argue that the same technology can be used by batsman to figure out bowlers strength and weakness as well but still bowlers have a slight advantage in this case cause they have many chances to get back at a batsman while the batsman has only 1 chance. So overall not a very high scoring point against him but another important aspect.
Fielding
Of all the videos of test cricket in the old times what can be seen is the predictibility when it comes to areas like field setting and the quality of fielding. A test match field would typically be 3-4 slips, 1-2 gully 2 fielders in d covers a fine leg and 1-2 on the leg side. Such fields are employed even now but there are a lot of innovations that the captains try out now a days when it comes to field settings.
Other important aspect is the quality of fielding. Very rarely have I seen diving stops and fierce chases to field the ball in the olden times (apart from the match in Lagaan). In fact good shots those times were appreciated by fielders by clapping hands and more often than not if you hit a ball into the gap it used to go for a boundary.
As everyone knows Bradman was a layer who loved to dominate and score quick runs. Who knows with good fielding and proper planning there could have been ways to making him throw away his wicket by keeping him quite for a long time.
Other Factors
Apart from the major facts mentioned above there ar also factors like temperament to score big hundreds, quality of bats, over exposure to analysis, travel fatigue, pressure of performance that the modern breed of cricketers face, way test cricket was played back then, etc. but these are all subjective matters and pretty much cancel each other out in terms of pros n cons so I have not included them.
Conclusion
That concludes my analysis on this topic. Now what? Lets try to assign a positive and negative weight age to the factors discussed so far and try to find a correction factor for his average.
Impact of ODI’s -(15-20)%External Conditions +(8-10)% (uncovered pitches)-(4-6)% (less exposure to different conditions)Enhancement in Technology -(4-6)%Fielding -(10-12)%
Overall
-(25-34)%
So considering this correction factor his overall test average of 99.94 would have been some where in the higher 60?s or early 70?s. Even with all the factors applied still his average is about 10-12% higher than the best batsman of today’s age, which proves the greatness of this man when it comes to batting. Sad they didn’t have many recordings of him playing back then. Would have been a worthy collection for any cricket lover.

Looking for fast live cricket scores? Download CricRocket and get fast score updates, top-notch commentary in-depth match stats & much more! 🚀☄️