
'%20x='0'%20y='0'%20height='100%25'%20width='100%25'%20xlink%3Ahref='data:image/jpg;base64,/9j/2wBDAAYEBQYFBAYGBQYHBwYIChAKCgkJChQODwwQFxQYGBcUFhYaHSUfGhsjHBYWICwgIyYnKSopGR8tMC0oMCUoKSj/2wBDAQcHBwoIChMKChMoGhYaKCgoKCgoKCgoKCgoKCgoKCgoKCgoKCgoKCgoKCgoKCgoKCgoKCgoKCgoKCgoKCgoKCj/wgARCAAGAAoDASIAAhEBAxEB/8QAFgABAQEAAAAAAAAAAAAAAAAAAAYH/8QAFQEBAQAAAAAAAAAAAAAAAAAABAX/2gAMAwEAAhADEAAAAMdvAd3/xAAhEAACAQMDBQAAAAAAAAAAAAABAwIABBEFBhIIEyFR0v/aAAgBAQABPwDa7o3sLazuVcw9kV8+5IYyfQp/TpuMuYV6powhnxks+K//xAAXEQEAAwAAAAAAAAAAAAAAAAABAAIh/9oACAECAQE/AKus/8QAGREAAgMBAAAAAAAAAAAAAAAAAQIABCJB/9oACAEDAQE/ALWEQA8n/9k='%3E%3C/image%3E%3C/svg%3E)

The ICC Champions Trophy 2017 is well underway in England and there has been no shortage of entertainment in all three departments of the game. However, the rain has dampened the spirits of fans all over the world with the Duckworth-Lewis-Stern method being applied to almost every single game so far. The Australian cricket team have been at the receiving end and would count themselves extremely unlucky as both the matches they have played have not had a result.
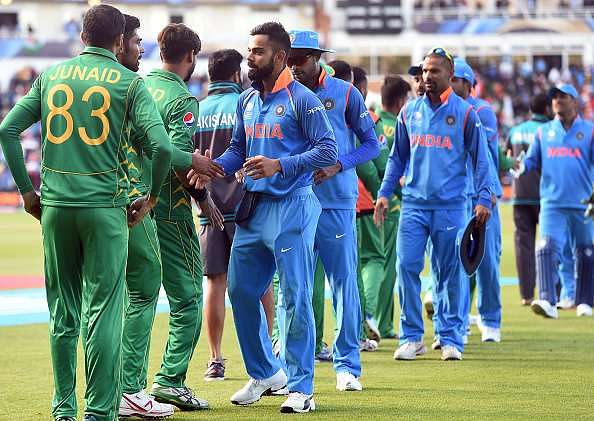
India too had their match curtailed against Pakistan but kept the pressure on their rivals by taking wickets at regular intervals and thus winning the match with ease.
With the D/L/S system having more of say than any of the players in this tournament, let’s break down the system and see how it works.
The system was invented by Frank Duckworth and Tony Lewis. It was used successfully for the first time in1997 by the International Cricket Council (ICC), the ECB (England & Wales Cricket Board) and the Zimbabwe Cricket Union (ZCU). A few modifications were made a few years ago through a software called Stern to make the calculation a lot easier.
The system works with a notion that each team have a certain amount of resources available to them at each point in the innings.
The system has two editions, namely Standard Edition and Professional Edition. The Professional Edition is the one used in all International and First-class games as the complex calculations of available resources require the use of a computer program and are not publicly available.
In the game of cricket, two resources are available to the team batting – wickets and resources. So, for a 50-over -game, each team would have 100% resources (10 wickets and 50 overs) available with them at the beginning of the innings.
As the game progresses, the team would lose resources based on the number of wickets lost and overs remaining.
So, in order to decide the revised score for either side in a rain-curtailed encounter, targets are hence revised in a way that is proportional to the number of resources available to each team.
Also Read: Captain Eoin Morgan calls for change in rules after Duckworth-Lewis denies England victory
The number of resources lost and rate at which they are lost depend upon the scoring pattern of the ODIs which keeps changing over the years. For example, if in an ODI, a team bats for 30 overs and scores 180 with the loss of 3 wickets. If it begins to rain and they lose 10 overs, they will then have to bat for a total of 40 overs.
But, they went on for 30 overs with the intention of batting for the entire quota of 50 overs. If they knew from the very beginning that they had to bat for 40 overs, they would have changed their approach and probably played aggressively. With the reduction in overs, they would lose a certain amount of resources available to them.
Hence, a few runs extra would be added to the total of the batting side after the completion of 50 overs based on the number of resources lost.
This was seen in the recently concluded match between India and Pakistan in the ICC Champions Trophy 2017. (explained later)
Similarly, if the side batting second loses overs while chasing a target, they would lose a certain number of resources which were available to them. Hence their revised target would be scaled down to the number of resources lost.
| Wickets Lost | |||||
| Overs Left | 0 | 2 | 5 | 7 | 9 |
| 60 | 107.1 | 87.9 | 50.0 | 26.5 | 7.6 |
| 50 | 100.00 | 83.8 | 49.5 | 26.5 | 7.6 |
| 40 | 90.3 | 77.6 | 48.3 | 26.4 | 7.6 |
| 30 | 77.1 | 68.2 | 45.7 | 26.2 | 7.6 |
| 25 | 68.7 | 61.8 | 43.4 | 25.9 | 7.6 |
| 20 | 58.9 | 54.0 | 40.0 | 25.2 | 7.6 |
| 10 | 34.1 | 32.5 | 27.5 | 20.6 | 7.5 |
| 5 | 18.4 | 17.9 | 16.4 | 14.0 | 7.0 |
Note: The following table changes over the years based on the scoring pattern of ODIs. For now, we will use this table and take a look at a couple of scenarios to make the explanation a lot easier.
Scenario 1:
If Team 1 scores 300 in 50 overs, they would have used 100% of their resources. Now, if it rains and Team 2 are given only 40 overs to chase the target, they would have only 90.3% of the resources available to them.
Hence, according to the formula,
Team 2’s par score = T1's score x (T2's resources/T1's resources) = 300 x (90.3/100) = 270.9, or 271.
Let’s take another example:
Scenario 2: India vs Pakistan, ICC Champions Trophy 2017:
India scored 173 runs in 33 overs with the loss of 1 wicket. According to the D/L table, India had about 50% of their resources remaining at that point. But then, the maximum number of overs were reduced to 48 thus leaving India with 15 overs remaining and not 17.
Thus the number of resources left with India would be a little less than 50%. For easy calculation purposes, let’s say it was 48.5%. So, the total number of resources lost for India would be 50 – 48.5 = 1.5%. Thus, 5 runs were added to Pakistan’s revised target. (1.5/100*319 = 4.785)
Now, when Pakistan resumed their batting, the began with 100% resources available to them. However, the rain returned after 4.5 overs with the loss of 0 wickets. Hence, Pakistan had around 95% of their resources remaining. But the match was reduced to 41 overs which meant that Pakistan had 36 overs remaining, which is around 83% of their resources. Hence, they lost 12% of their resources. Thus, they had to chase 289.

Looking for fast live cricket scores? Download CricRocket and get fast score updates, top-notch commentary in-depth match stats & much more! 🚀☄️