
'%20x='0'%20y='0'%20height='100%25'%20width='100%25'%20xlink%3Ahref='data:image/jpg;base64,/9j/2wBDAAYEBQYFBAYGBQYHBwYIChAKCgkJChQODwwQFxQYGBcUFhYaHSUfGhsjHBYWICwgIyYnKSopGR8tMC0oMCUoKSj/2wBDAQcHBwoIChMKChMoGhYaKCgoKCgoKCgoKCgoKCgoKCgoKCgoKCgoKCgoKCgoKCgoKCgoKCgoKCgoKCgoKCgoKCj/wgARCAAGAAoDASIAAhEBAxEB/8QAFgABAQEAAAAAAAAAAAAAAAAAAAYH/8QAFQEBAQAAAAAAAAAAAAAAAAAABAX/2gAMAwEAAhADEAAAAMdvAd3/xAAhEAACAQMDBQAAAAAAAAAAAAABAwIABBEFBhIIEyFR0v/aAAgBAQABPwDa7o3sLazuVcw9kV8+5IYyfQp/TpuMuYV6powhnxks+K//xAAXEQEAAwAAAAAAAAAAAAAAAAABAAIh/9oACAECAQE/AKus/8QAGREAAgMBAAAAAAAAAAAAAAAAAQIABCJB/9oACAEDAQE/ALWEQA8n/9k='%3E%3C/image%3E%3C/svg%3E)

Being a cricket tragic, I have often faced interesting conundrums. None, perhaps, has been more challenging than determining who the greatest match winner is among the top Test batsmen. While it is near impossible to compare across eras given the vastly different conditions, context, and bowling quality, it is perhaps a much more realistic exercise to try and compare the performances of batting greats who have all graced the cricket field in the same generation. Although this does not quite imply that the conditions were always similar, the problem is definitely a simplified version.
In the last 30 years, which is roughly the time since I started following cricket closely, few cricketers have charmed the world like Sachin Tendulkar did. Tendulkar’s longevity and consistency across the world inevitably ensure that he is part of nearly every major all-time XI drawn up.
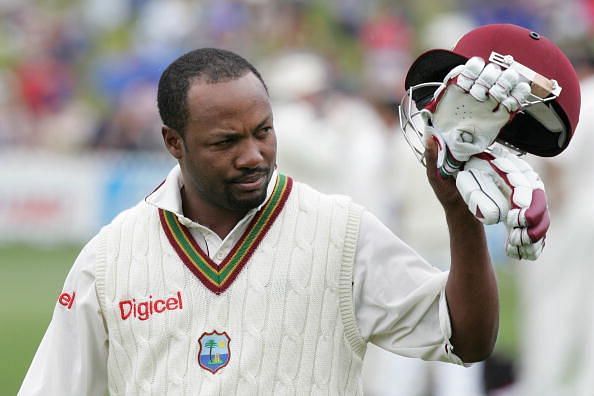
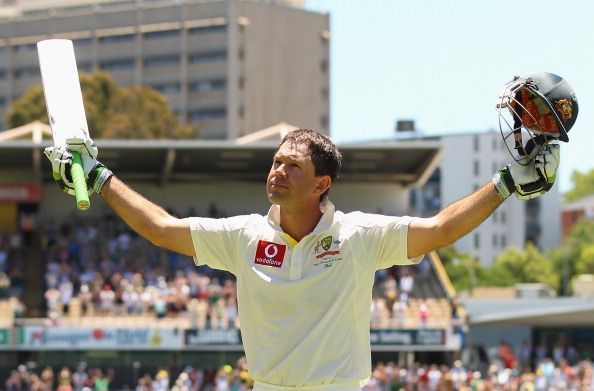
The generation also witnessed the genius of Brian Lara, the gritty Rahul Dravid, and the Sri Lankan great, Kumar Sangakkara. Two other exceptional players in the list include Ricky Ponting, who was the premier batsman in what was perhaps the finest team of all time, and Jacques Kallis, who is perhaps the only cricketer who can be compared with the all-rounder per excellence, Gary Sobers.
Now, one might ask how I am going about determining who the best match winner among these greats is. For this analysis, I consider the following:
- Performance in wins versus the performance overall
- Peer comparison in matches won
- Home wins versus away wins (performance comparison)
- Score distribution in wins
- Innings wise distribution
- Win performance index – determined by analyzing bowling quality faced
All stats exclude matches against Bangladesh and Zimbabwe
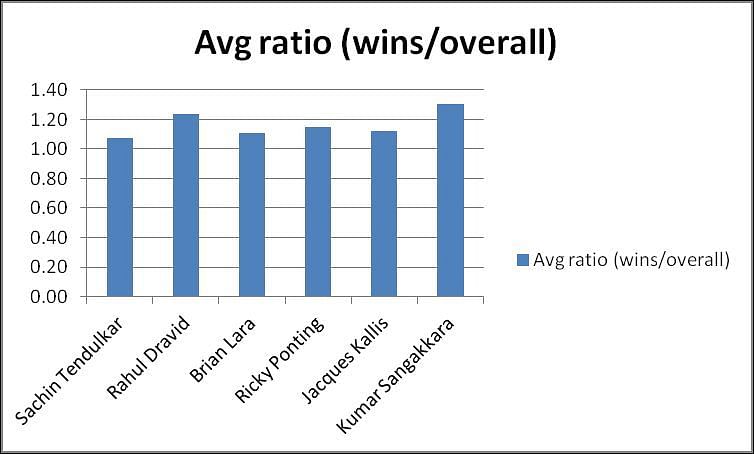
Performance in wins versus performance overall
This analysis will help us understand how these batting greats stepped it up when it mattered. Although Test matches are ultimately won by bowlers, it is the batsmen who need to set the platform. A century in the first innings usually ensures that the team is on the front foot for much of the contest.
Also, these top batsmen were renowned for producing those extraordinary back-to-the-wall knocks when the team was in a tough spot. Ponting, who has one of the finest records in the final innings, and Lara, who often shepherded a poor West Indies team, were among the best in pressure situations.
Dravid, whose magnificent 233 lifted India to a remarkable win over Australia in Adelaide, played numerous quality innings in Indian wins.
Tendulkar, who for much of his career played in a weak Indian team that could never quite match his consistency to ensure a win, found strong support in the latter half of his career and produced many vital knocks, including a century against England in Chennai to help chase down 387.
When we consider the percentage of overall runs scored in wins, Ponting comes up well on top (67%). This clearly reflects the exceptional quality of the Australian team he was part of. Kallis comes a distant second (45%) while three others (Sangakkara, Dravid and Tendulkar) have corresponding numbers between 30% and 40%.
Lara, who was unlucky to be part of a steadily declining West Indian outfit, scored just 23% of his runs in wins. Interestingly, when it comes to the comparison of performance in wins versus the overall performance, Sangakkara and Dravid come out on top. The average ratio (wins to overall) is 1.30 for Sangakkara and 1.24 for Dravid.
Tendulkar and Lara have maintained about the same level of performance in wins as they have done in their overall career (1.08 and 1.11 respectively).
Peer comparison in wins
This metric, according to me, provides a great indication of how crucial a batsman’s contribution has been in a winning cause.
Not only does it offer a way of comparing the batsman’s performance with that of his team mates (top 5 batsmen) but also helps us understand how much better or worse he fared compared to the opposition’s finest (top 5).
Knocks such as Lara’s 153* immediately come to mind, as it stood out when compared to his team mate’s efforts but was matched by Steve Waugh’s 199 in the same game. Dravid’s two half centuries on a spiteful track in Jamaica in 2006 (runs per wicket in the match were < 18) were among the best played by an Indian batsman abroad.
When we analyse the peer performance in wins, we find that Tendulkar’s average in wins is slightly lower than that of his team mates (average ratio R1 = 0.97). This can perhaps be explained by the fact that he was part of a strong batting line-up (Dravid, Laxman and Sehwag) in the second half of his career.
However, Tendulkar has outperformed the opposition’s top batsmen by 41% (R2 = 1.41) in India wins. The corresponding numbers for Dravid are 1.17 and 1.54. Lara, who for a significant part of his career, received very little support from his batsmen, has an average that matches those of his top batsmen (R1 = 0.99) and completely outperforms opposition batsmen (R2 = 1.87).
Among the other three batsmen, it is interesting to note Sangakkara’s performance for his average is 25% better than his team mates in wins (the best among the batsmen considered).

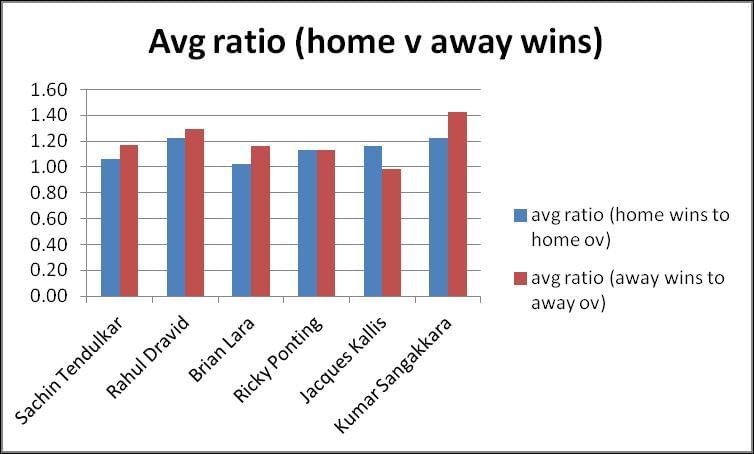
Home wins versus away wins
Often, a batsman’s career is evaluated only by his away performances. This is unfair, in my opinion. While away performances must surely get more recognition given the challenging conditions, home games almost always come with the burden of fans’ expectations and thus add a massive layer of difficulty.
When we analyse the performance of the greats in home wins, Ponting again comes out on top with 76% of his home runs coming in wins. This goes on to further underline Australia’s unprecedented dominance in the 2000s.
Kallis and Sangakkara, who were also part of teams that had a strong home record, have corresponding numbers of 59% and 51%. Lara, once again, is at the bottom of the list with just 32% of his home runs in wins.
The home average ratio (ratio of average in wins to the overall average in home Tests) sees Dravid and Sangakkara come out on top (1.22) while Tendulkar and Lara finish in the bottom two (1.06 and 1.02 respectively). When it comes to the away performances (away and neutral Tests considered), Ponting once again leads the way with 55% of his runs in wins while Kallis and Dravid follow with figures of 30% and 24%. This points to Dravid’s hugely important role in wins abroad (233 in Adelaide, the knocks in Jamaica, 270 in Rawalpindi). Sangakkara and Dravid finish on top when we consider the away average ratio (ratio of average in away wins to overall away average).
Interestingly, Kallis’ corresponding ratio is slightly below 1, indicating that his performance in wins was not better or worse than his overall away display.
Scores distribution
Do the top batsmen actually raise their level of play in wins and avoid dismissals for low scores? Do they ensure that the fifties get converted into big centuries? We often think so. What do the numbers say?
The answer is that all batsmen considered fall below 50 in more than 50% of the innings (wins only). Kallis and Tendulkar have the highest % of innings where they have fallen under 50 (57% and 56%). However, when they do get a start, opposition teams are made to pay. Lara has made scores between 50 and 99 in 31% of the innings while Dravid and Sangakkara follow, with 24% each.
Only 6 of Lara’s 34 Test centuries came in wins and one of them was a magnificent 213 at Jamaica in 1999 against the powerful Australian team led by Steve Waugh. In 12 % of his innings, he made 100+ scores. Leading the way in this category, however, are Ponting (16%) and Dravid (14%).
While every batsman had a higher proportion of sub-50 scores in the career as compared to wins, Dravid, Ponting and Kallis are the ones who had a higher % of 100+ scores in wins as compared to their overall career figures.

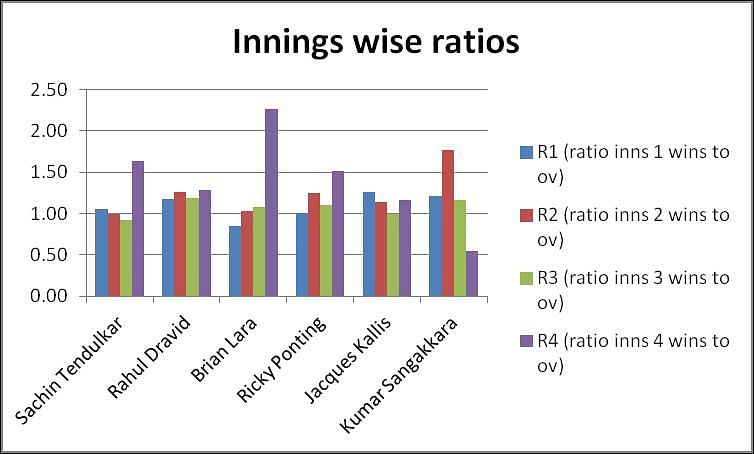
Innings wise performance
Which innings is the most challenging one for a batsman? There is no easy answer to this question. Given that conditions can drastically change during the course of a match, what seemed to be a difficult pitch to bat on in the first innings can suddenly transform into a flat track on the final day.
In sub-continental conditions, batting often gets much tougher as the game goes on and final innings centuries become extremely rare and valuable.
The first innings often sets the tone for what is to follow and most top batsmen seek to leave their mark early in the contest. Except Lara, who averages 57.3 in the 1st innings in wins, the other batsmen average more than 60 with Kallis topping the list at 67.9.
Sangakkara has an astonishing record in the second innings in wins (average 104) and is followed by Dravid (72.3) and Ponting (65.2). The averages in the third innings drop for most batsmen except Kallis and Sangakkara, who average above 60 each.
In the fourth innings, which is perhaps the stiffest test for batsmen given the pressure of a chase, Lara averages an exceptional 81 in wins followed by Ponting (67). At the other extreme is Sangakkara, who averaged just over 22 in the 4th innings in wins.
While Lara’s 153* remains one of the greatest knocks in a big chase, Ponting scored superb centuries against South Africa in Cape Town (2002) and Sydney (2006) when faced with big targets. On the second occasion, his century made him the only player to record twin centuries in his 100th Test.
The ratios R1, R2, R3 and R4 compare the averages of the batsmen in the four innings in wins to their corresponding numbers in their overall career. In line with the averages, Kallis and Sangakkara have the highest R1 (1.26) and R2 (1.77). Dravid leads the way in R3 (1.19) while Lara and Ponting end up on top in R4 (2.26 and 1.51).

Win performance index (WPI)
Even after comparing these batting greats across all these parameters, it is still extremely difficult to determine who can be considered the best in wins. This is because quantifying the context is highly challenging.
One of the key factors that helps evaluate the performance in wins is the bowling quality faced. Since these batsmen have had long careers (12 years+), I have split the careers into distinct phases.
This is necessary because the bowling quality of teams (bowling average) has varied significantly over the years. For example, Australia had a world-class attack between 1999 and 2007 but went through a rough patch for the next 3-4 years following the retirement of Glenn McGrath and Shane Warne.
Hence the knocks played against the Australian attack of the early 2000s must be ranked higher than the performances against Australia in the later years. The bowling quality is calculated by taking the ratio of the bowling average of the opposition (all teams combined) to the all-time bowling average (31.48 - across all top teams excluding Zimbabwe and Bangladesh).
This bowling quality factor (calculated for each phase) is combined with the number of matches and averaged across the career.
Win performance index = [(BQ1 * M1) + (BQ2*M2) + (BQ3*M3) + (BQ4*M4)]/(M1+M2+M3+M4)
Where BQ represents the bowling quality factor in each phase and M1-M4 represent the number of matches won in each phase.
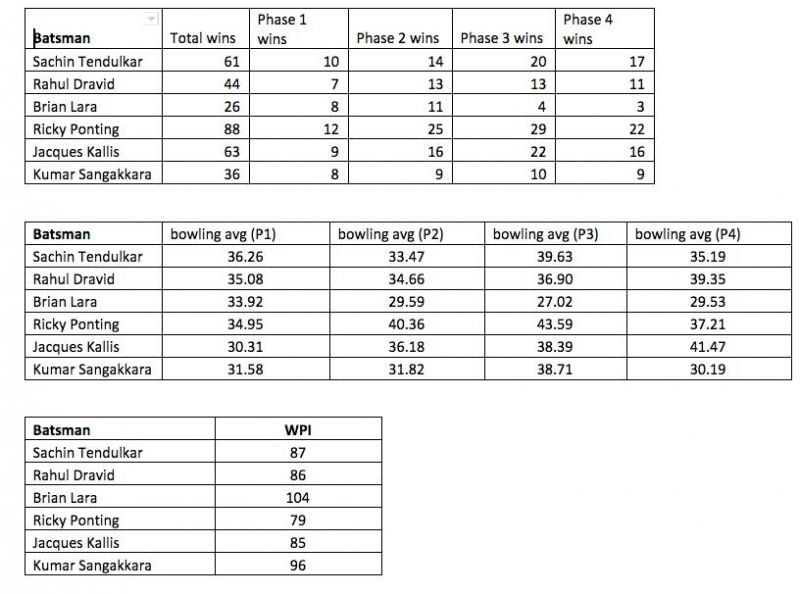
This analysis puts Lara on top, with a score of 104 followed by Sangakkara (96). Tendulkar, Kallis and Dravid have scores in the 80s while Ponting comes in last with a score of 79. The high scores for Lara and Sangakkara are a result of them playing in weak teams and often coming up against relatively better bowling attacks.
In contrast, Ponting, by virtue of playing in a champion team, often faced attacks that were far less potent. Tendulkar, Kallis and Dravid played in balanced teams that often came up against evenly matched opponents.
Among the batting giants of the last 30 years, Tendulkar, Dravid and Kallis remain the most consistent across all parameters considered. Ponting has had outstanding numbers and has been part of an exceptionally successful team too.
Sangakkara’s stats place him among the very best and remind us how big a void his retirement has left in Sri Lanka’s batting.
Lara, who, depending on his mood, could sway between the sublime and the ordinary in the same game, has terrific numbers in two categories (peer comparison with opposition batsmen, fourth innings ratio) and finishes on top in the win performance index. He might well be considered the player with the greatest impact in wins given his team’s otherwise sorry record in Tests in the last two decades.
Looking for fast live cricket scores? Download CricRocket and get fast score updates, top-notch commentary in-depth match stats & much more! 🚀☄️