
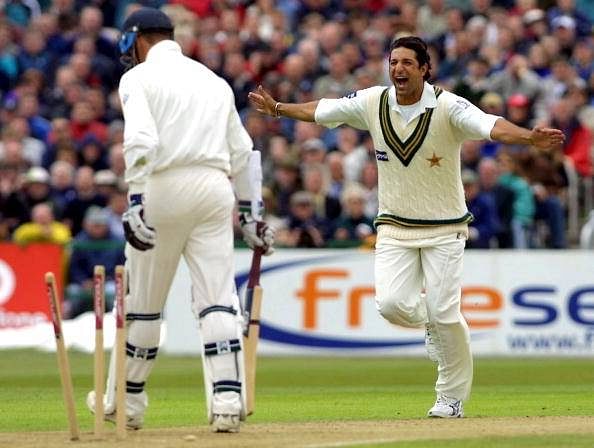
Have you ever noticed that most of the wickets we watch from the pre-2000 era were ‘bowled’ out rather than caught or some other mode of dismissal? Even if you did not, I certainly did. How many times have we watched Kapil Dev, Wasim Akram, Waqar Younis, Dennis Lillee, Imran Khan, Javagal Srinath, Courtney Walsh etc. somehow managing the ball to avoid the bat and break the stumps?
The site of bowler hitting the stumps with a peach of a delivery is quite rare these days. Now a batsman is dismissed by getting caught more often than in the 20th century. The reasons for this higher percentage of caught outs and a lower percentage of bowled out can be increased bat sizes, less swing and seam movement and improved batting techniques.
In my opinion, however, depleted swing is the main cause for a decrease in the rate of dismissals done by rattling the batsman’s stumps. For instance, just watch any bowler bowling in the 80’s or 90’s and you would notice a huge amount of swing and that too, very late swing. On the other hand, deliveries these days remain as straight as an arrow and the batsmen have to spot the ball once and then go for it without fearing any movement.
Increase in the bat size
Over the past ten years or so, Cricket has changed dramatically; it has got more pace than it ever had. Apart from the introduction of T20 Cricket, it is often said that bat sizes are also responsible for this shift in momentum. Over the years, the bat sizes have increased considerably. We often listen to commentators using words like weapons for the modern bats. Even the mis-hits from these bats go beyond the boundaries.
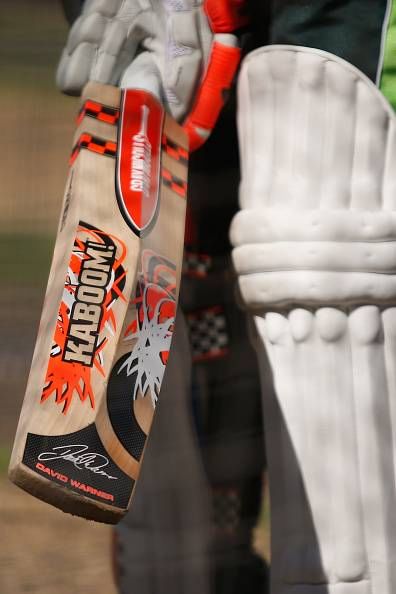
Recently in a discussion, Barry Richards held his bat with which he played in 1970 and Warner’s bat which he was using in a Test Match in November 2015. He was astonished to see the difference between the sizes of both bats. The 70’s bat looked just like a stump in front of Warner’s bat and yet the difference between their weights was just 30 oz. (1 oz=28.35 grams)
The increased bat sizes have disturbed the balance between bat and ball, due to which there has been a lot of hue and cry from the cricketing circles. Umpires have been forced to wear helmets and critics are concerned about the safety of the bowlers.
Fielding captains have to set their fielders as per containment policy rather than getting wickets. ICC needs to bring some regulations upon bat sizes and also upon the sizes of grounds. Boundaries should have some standard size, sometimes, a 55-meter hit goes for a six while in some parts of the world, 80-plus meter stroke lands safely in fielder’s hands.
ODI’s Dismissal Summary Decade by Decade with Percentages
We decided to dig some numbers to verify whether the above-stated 'caught' or 'bowled' dismissal ratio phenomena is true or we have been deluded by the fact that mostly 'bowled' dismissals are popular from the past century since they are more spectacular. We decided to check dismissals in ODI matches from 5th Jan 1971 to this day, decade by decade.
Here is the table which shows our results. The table with only most common modes of dismissals has been analysed hereinunder with the help of graph.
| 1971-1979 | Percentage | 1980-1989 | Percentage | 1990-1999 | Percentage | 2000-2009 | Percentage | 2010-Date | Percentage | |
| All Innings | 1418 | 8838 | 16266 | 24510 | 14186 | |||||
| Retired Hurt | 2 | 0.14 | 14 | 0.16 | 24 | 0.15 | 26 | 0.11 | 15 | 0.11 |
| Not Out | 261 | 18.41 | 1735 | 19.63 | 3043 | 18.71 | 4514 | 18.42 | 2533 | 17.86 |
| Obstructing | 0 | 0.00 | 2 | 0.02 | 0 | 0.00 | 1 | 0.00 | 3 | 0.02 |
| Handling | 0 | 0.00 | 1 | 0.01 | 1 | 0.01 | 0 | 0.00 | 1 | 0.01 |
| Hit Wicket | 3 | 0.21 | 9 | 0.10 | 16 | 0.10 | 25 | 0.10 | 11 | 0.08 |
| Stumped | 20 | 1.41 | 175 | 1.98 | 459 | 2.82 | 527 | 2.15 | 314 | 2.21 |
| Run Out | 111 | 7.83 | 906 | 10.25 | 1699 | 10.45 | 1942 | 7.92 | 887 | 6.25 |
| LBW | 118 | 8.32 | 553 | 6.26 | 1146 | 7.05 | 2099 | 8.56 | 1250 | 8.81 |
| Bowled | 298 | 21.02 | 1691 | 19.13 | 2625 | 16.14 | 3767 | 15.37 | 2126 | 14.99 |
| Caught | 605 | 42.67 | 3752 | 42.45 | 7253 | 44.59 | 11609 | 47.36 | 7046 | 49.67 |
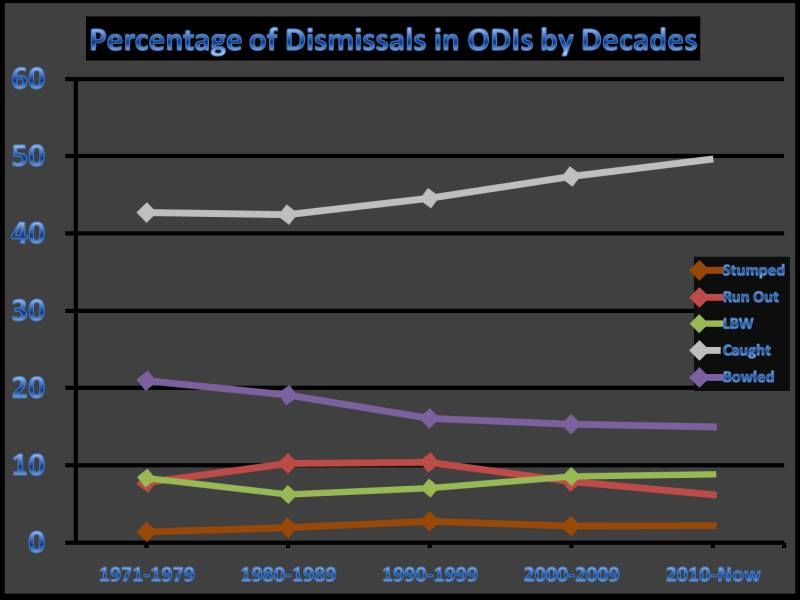
It is quite evident from the graph that caught out mode of dismissal has gained some real pace over the years. It started from 42%, dropped some decimals in 1980’s but after that, it has been on the rise. Today it stands fractionally under 50%, on the other hand, ‘bowled’ dismissals have been on a decline. Starting from two decimals above 21% in the first decade, it has now dropped to a decimal below 15%.
Run-outs and LBWs competed with each other or we can say, have complimented each other over the years since their collective percentage remained in between 15.06 and 17.49 during all the five decades. Both started from almost similar spots (LBW was fractionally above run-outs).
In the second decade, run-outs increased at an almost equal pace at which LBWs decreased. They both remained somewhat stable in the third decade (1990-1999), with a slight rise in LBWs. In the fourth decade, LBW came on the top mainly due to the sudden decline in run-outs. In the current decade, LBWs are much more frequent than run outs, a fact which is quite visible in the above graph.
Finally, dismissals through stumping increased in the first two decades from 1.41% to 1.98% and then reached its highest percentage, 2.82 in 1990-1999. After that, it has been on the downward slope with 2.15% and 2.21% in recent decades.
Brand-new app in a brand-new avatar! Download CricRocket for fast cricket scores, rocket flicks, super notifications and much more! 🚀☄️
