
'%20x='0'%20y='0'%20height='100%25'%20width='100%25'%20xlink%3Ahref='data:image/jpg;base64,/9j/2wBDAAYEBQYFBAYGBQYHBwYIChAKCgkJChQODwwQFxQYGBcUFhYaHSUfGhsjHBYWICwgIyYnKSopGR8tMC0oMCUoKSj/2wBDAQcHBwoIChMKChMoGhYaKCgoKCgoKCgoKCgoKCgoKCgoKCgoKCgoKCgoKCgoKCgoKCgoKCgoKCgoKCgoKCgoKCj/wgARCAAGAAoDASIAAhEBAxEB/8QAFgABAQEAAAAAAAAAAAAAAAAAAAYH/8QAFQEBAQAAAAAAAAAAAAAAAAAABAX/2gAMAwEAAhADEAAAAMdvAd3/xAAhEAACAQMDBQAAAAAAAAAAAAABAwIABBEFBhIIEyFR0v/aAAgBAQABPwDa7o3sLazuVcw9kV8+5IYyfQp/TpuMuYV6powhnxks+K//xAAXEQEAAwAAAAAAAAAAAAAAAAABAAIh/9oACAECAQE/AKus/8QAGREAAgMBAAAAAAAAAAAAAAAAAQIABCJB/9oACAEDAQE/ALWEQA8n/9k='%3E%3C/image%3E%3C/svg%3E)
The year was 1999. In Chennai, Bhogi had been celebrated more than two weeks back but the smog was still fresh in the air. India were in the middle of a pulsating Test match at Chepauk. The match eventually ended Pakistan’s way despite a brilliant 136 by Sachin Tendulkar. After watching India lose, I was inconsolable. My grandmother, who had the rather pitiable job of making me eat food for the next few days, gave in on the third day after the loss. She said, “Swaroop, idhukellam upset allama. Innum life-la edhallamo pakka vendi-irrukum. Sachin adicha India-ku luck illada” (roughly translated to “Swaroop, you can’t get upset because of this. You will have to see lots of things in life. In fact, whenever Sachin scores, we lose”).
In Inception, Dom Cobb plants an idea into the mind of a subject he wants to extract information from and watches it as the idea expands or something similar.
Looking back at what my grandmother said, I begin to wonder whether this nugget of information that everybody are posting on Twitter and Facebook right now that “whenever Sachin scores, India loses” has somehow been reared into the genetic psyche when all of us were kids. Of course, there is another myth going around. He slows down when he gets into his 80s.
There is only so much a man can take after listening to such amounts of criticism about somebody before embarking on a fact-finding mission to find out whether the information that exists in the mainstream is valid or not. Given how most of us are likely to go by hearsay, I’m quiet confident that most of what is out there is either fabricated or the truth conveniently distorted to suit the opposition for whatever reasons.

But there are limitations about the fact-finding mission. I am going to be doing the ODI 100s only from 2001 (4th July, 2001) as Cricinfo started commentating on games only from then. However, I will be delving deep into each and every 100 that I can remember since I started watching the game.
You may ask why I want to this right now? I’m a little raged and a bit pissed right now. So my emotional self is ruling me right now.
P,S, To find out whether Tendulkar does slow down when approaching a 100, I have decided to break down all his 100 plus (from 2001) into three categories. Balls taken to reach 0-85 (with a range from 83 to 92). Balls taken to reach 81-100. And from 101-till dismissal.
India v West IndiesHarare Sports Club, 4 July 2001
Opponents – West Indies. Result – Won. Batting – Second.
1st batch – 85 from 96 balls. Strike Rate – 88.54
2nd batch – 15 from 16 balls. Strike Rate – 93.75
3rd batch – 22 from 19 balls. Strike Rate – 115.78
Total – 122 (not out) from 131 balls.
Conclusion – This is an interesting find. So he chased down a target carrying India through. Not only that, he also upped the ante once he reached the 80s.
South Africa v India
New Wanderers Stadium, Johannesburg, 5 October 2001
Opponents – South Africa. Result – Lost. Batting – First.
1st batch – 87 from 116 balls. Strike Rate – 75.00
2nd batch – 14 from 13 balls. Strike Rate – 107.69
Total – 101 from 129 balls.
Conclusion – Anybody who remembers this match might well remember that this was Tendulkar’s comeback game from an injury. But yet again another instance when the first batch is slower than the second batch. We did go on to lose this game after posting 279 but truth be said this was a Sachin Tendulkar struggle and will not really be mentioned when people talk about his great One-day hundreds.
India v Kenya
Boland Bank Park, Paarl, 24 October 2001
Opponents – Kenya. Result – Won. Batting – First
1st batch – 84 from 82 balls. Strike Rate – 102.43
2nd batch – 16 from 18 balls. Strike Rate – 88.88
3rd batch – 46 from 32 balls. Strike Rate – 143.75
Total – 146 from 132 balls.
Conclusion – This is admittedly slower than the first and third batches but given how people say that he is considerably slower than his career strike rate of 86.18, he actually is above that.
England v India
Riverside Ground, Chester-le-Street, 4 July 2002
Opponents – England. Result – NR. Batting – First
1st batch – 87 from 96 balls. Strike Rate – 90.62
2nd batch – 13 from 10 balls. Strike Rate – 100.00
3rd batch – 5 from 2 balls. Strike Rate – 250.00
Total – 105 (not out) from 108 balls.
Conclusion – As the scoreboard suggests, this was a period when Tendulkar used to come in at No.4 for India in the ODIs. In this particular, he came in at a tricky time and helped steady the ship with Rahul Dravid before reaching three figures with a couple of overs to spare. As far as the strike rates are concerned, he’s ahead of the first batch by about 10 runs per 100 balls.
India v Sri Lanka
The Royal & Sun Alliance County Ground, Bristol, 11 July 2002
Opponents – Sri Lanka. Result – Won. Batting – First
1st batch – 84 from 80 balls. Strike Rate – 105.00
2nd batch – 16 from 13 balls. Strike Rate – 123.07
3rd batch – 13 from 9 balls. Strike Rate – 144.44
Total. 113 from 102 balls.
Conclusion – Again coming in at No.4, an experiment which ultimately was a failure, Tendulkar did have a few good knocks. And again an impressive strike rate which keeps going up all the time till his eventual dismissal.
India v Namibia
City Oval, Pietermaritzburg, 23 February 2003
Opponents – Namibia. Result – Won. Batting – First.
1st batch – 84 from 96 balls. Strike Rate – 87.50
2nd batch – 16 from 19 balls. Strike Rate – 84.21
3rd batch – 52 from 36 balls. Strike Rate – 144.44
Total – 152 from 151 balls.
Conclusion - His only century in the 2003 World Cup, there is a marginal decrease in the 90s but not by some exaggerated margins. But do not worry haters, this shall be counted as a negative when it comes down to the final calculations.
India v Australia
Captain Roop Singh Stadium, Gwalior, 26 October 2003
Opponents – Australia. Result – Won. Batting – First.
1st batch – 85 from 95 balls. Strike Rate – 89.47
2nd batch 15 from 24 balls. Strike Rate – 62.50
Total – 100 from 119 balls
Conclusion – The first real indication that Tendulkar perhaps did take his time in the 90s as there is a marked drop of about 25 runs per every 100 balls scored.
India v New Zealand
Lal Bahadur Shastri Stadium, Hyderabad, 15 November 2003
Opponents – New Zealand. Result – Won. Batting – First.
1st batch – 84 from 76 balls. Strike Rate – 110.52
2nd batch – 16 from 11 balls. Strike Rate – 145.45
3rd batch – 2 from 4 balls. Strike rate – 50.00
Total – 102 from 91 balls.
Conclusion – His second of the TVS series, India run up a huge score and the Kiwis were never in the races. And a marked improvement in the strike rate in the 90s again.
Pakistan v India
Rawalpindi Cricket Stadium, 16 March 2004
Opponents – Pakistan. Result – Lost. Batting – Second.
1st batch – 84 from 88 balls. Strike Rate – 95.45
2nd batch – 16 from 18 balls. Strike Rate -88.88
3rd batch – 41 from 29 balls. Strike Rate – 141.37
Total – 141 from 135 balls.
Conclusion – His second 100 only while chasing since 2001, this is one of the very few fair criticisms over the years. While there is a marked decrease in the strike rate in the 90s, that is still above his career strike rate. One of quite a few glorious failures that Tendulkar has had while chasing a game.
India v Pakistan
Sardar Patel Stadium, Motera, Ahmedabad, 12 April 2005
Opponents – Pakistan. Result – Lost. Batting – First.
1st batch – 88 from 96 balls. Strike Rate – 91.66
2nd batch – 12 from 9 balls. Strike Rate – 133.33
3rd batch – 23 from 25 balls. Strike Rate – 92.00
Total – 123 from 130 balls.
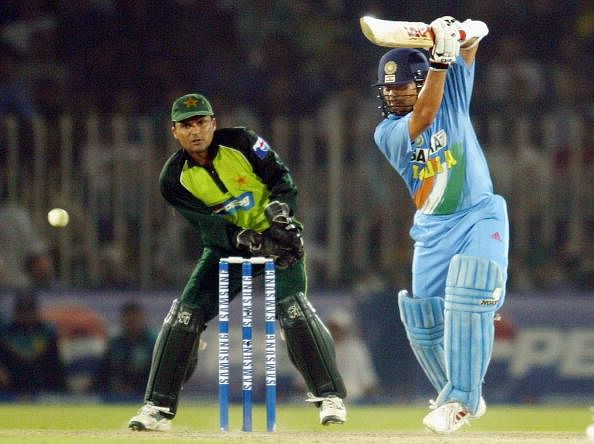
Conclusion – For the second time in a row, a losing 100 against Pakistan. If I remember right, Inzamam played a gutsy little knock at the death to win the game for the visitors. The Strike Rate in the 90s kind of explains itself.
Pakistan v India
Arbab Niaz Stadium, Peshawar, 6 February 2006
Opponents – Pakistan. Result – Lost. Batting – First.
1st batch – 85 from 96 balls. Strike rate – 88.54
2nd batch – 15 from 16 balls. Strike Rate – 93.75
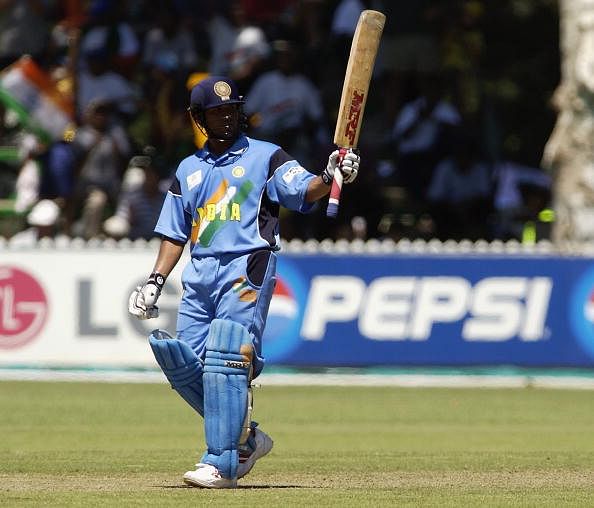
Total – 100 from 113 balls (After getting to a 100, Tendulkar got out the very next ball).
Conclusion - For a third time in a row, a 100 against Pakistan in a losing cause. There is a marginal improvement in the 90s but he gave his wicket away cheaply after reaching a 100 and perhaps could have avoided that. Pakistan went on to win the game in the D/L method.
India v West Indies
Kinrara Academy Oval, Kuala Lumpur, 14 September 2006
Opponents – West Indies. Result – Lost. Batting – First.
1st batch – 85 from 110 balls. Strike Rate – 77.27
2nd batch – 15 from 9 balls. Strike Rate – 166.66
3rd batch – 41 from 29 balls. Strike Rate – 141.37
Total – 141 not out from 148 balls.
Conclusion – An old school construction of an ODI innings. Build an innings and let it go to a crescendo during the death overs, Tendulkar held the sheet anchor while others around him went for broke. But what went again him was a fourth consecutive ODI defeat after scoring a 100. Maybe this is when the genesis that a Sachin 100 usually results in a defeat started spreading around Indian households.
India v West Indies
Indian Petrochemicals Corporation Limited Sports Complex Ground, Vadodara, 31 January 2007
Opponents – West Indies. Result – Won. Batting – First.
1st batch – 84 from 68 balls. Strike rate – 123.52
2nd batch – 16 from 8 balls. Strike Rate – 200.00
Total – 100 not out from 76 balls.
Conclusion – This was Tendulkar’s last 100 before the ’07 World Cup and as it proved in hindsight, last 100 before he came back to form Down Under. This was another experimental 100 as he came back at two down. Tendulkar, while the strike rate says that he upped the ante during the 2nd batch, did take a single of the last ball of the 50th over to reach three figures instead of trying to belt the ball over Vadodara. But more pleasingly, he did arrest the slide of 100 in losing efforts.
Australia v India
Sydney Cricket Ground, 2 March 2008
Opponents – Australia. Result – Won. Batting – Second
1st batch – 88 from 91 balls. Strike Rate – 96.70
2nd batch – 12 from 15 balls. Strike Rate – 80.00
3rd batch – 17 from 14 balls
Total – 117 not out from 120 balls.
Conclusion – This was Tendulkar’s worst period in ODIs (a couple of 99s notwithstanding). But he did come back with a bang against the might of Brett Lee and co. There were calls for his resignation back then and some people who I knew began to write him off as a spent bullet. Coming to the strike rate, there is a decrease during the 90s but given the way he stayed till the end and anchored the chase, one can hardly call this as “playing for himself”. (This, though, will count as a negative when it comes to counting the final averages.
New Zealand v India
AMI Stadium, Christchurch, 08 March 2009
Opponents – New Zealand. Result – Won. Batting – First
1st batch – 85 from 86 balls. Strike Rate – 98.83
2nd batch – 15 from 15 balls. Strike Rate – 100.00
3rd batch – 63 from 32 balls. Strike Rate – 196.87
Total – 163 from 133
Conclusion – A monster innings in which he monstered all the bowlers to all parts of the Christchurch field. Just a very marginal increase in the strike rate while reaching to the 100 before going berserk. A hat-trick of wins after a Tendulkar 100 also firmly establishing that the four lost on the trot was firmly out of the way.
Sri Lanka v India
R Premadasa Stadium, Colombo, 14 September 2009
Opponents – Sri Lanka. Result – Won. Batting – First
1st batch – 85 from 77 balls. Strike Rate – 110.38
2nd batch – 15 from 15 balls. Strike Rate – 100.00
3rd batch – 38 from 41 balls. Strike Rate – 92.68
Total – 138 from 133.
Conclusion – Tendulkar, ably sheet-anchored by Rahul Dravid at the other end, cut loose early on and maintained the momentum to set a target in excess of 300 in the final of the Compaq Cup. This was when Tendulkar started making noises about playing in a sixth World Cup. There is a fall of about 10 runs per 100 balls during the 90s but the mark of 100 is still very good.
India v Australia
Rajiv Gandhi International Stadium, Uppal, Hyderabad, 5 November 2009
Opponents – Australia. Result – Lost. Batting – Second.
1st batch – 92 from 71 balls (Tendulkar went from 80 to 92 with two sixers so I had to take till 92 as the first batch as it would have been cheating otherwise). Strike Rate – 129.57
2nd batch – 8 from 10 balls. Strike Rate – 80.00
3rd batch – 75 from 60 balls. Strike Rate – 125.00
Conclusion – Another one of those glorious failures which might haunt Tendulkar and his fans for life. And he fell while playing a little scoop over short fine leg. A marked decrease in the strike rate in the 90s, Tendulkar has been stacking them a bit of late.
India v South Africa
Captain Roop Singh Stadium, Gwalior, 24 February 2010
Opponents – South Africa. Result – Won. Batting – First
1st batch – 87 from 69 balls. Strike Rate – 126.08
2nd batch – 13 from 21 balls. Strike Rate – 61.90
3rd batch – 80 from 42balls. Strike Rate – 190.47
4th batch – 20 from 15 balls. Strike Rate – 133.33
Total – 200 not out from 147 balls.
Conclusion – The match which saw M.S. Dhoni’s fans come to a head-on collision with Tendulkar’s fans after the former was accused of almost denying a fine 200 by not giving enough strike at the end. But to be honest, Tendulkar was cramping and the pitch was that sort of pitch were even 400 wouldn’t have been enough. In the end, it all worked out well for India and Tendulkar. Coming to the strike rates, this has been, by far, his slowest going from 80 to a 100. And as a result, the strike rate slumped by more than half.
India v England
M Chinnaswamy Stadium, Bangalore, 27 February 2011
Opponents – England. Result – Draw. Batting – First.
1st batch – 87 from 88 balls. Strike rate – 98.86
2nd batch – 13 from 15 balls. Strike rate – 86.66
3rd batch – 20 from 12 balls. Strike Rate – 166.66
Total – 120 from 115 balls.
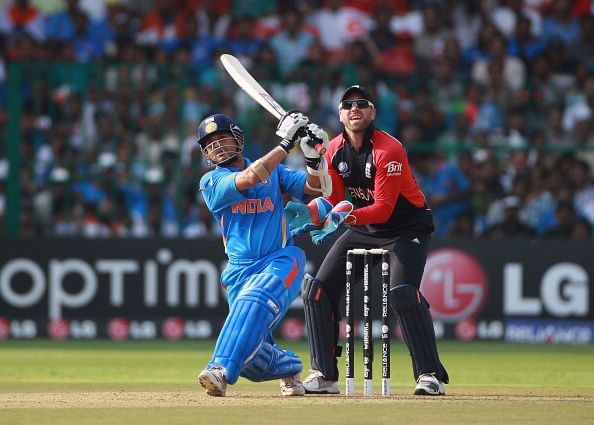
Conclusion – His first 100 of the 2011 World Cup, it was as a result of a direct onslaught against the likes of Graeme Swann that helped him get some momentum after a very slow start ( he was on 32 after facing 50 balls). Ultimately lost his wicket during the powerplay overs if my memory serves me right which helped England get back in the game. A decrease of 12 during the 90s but again more or less matching his career strike rate.
India v South Africa
Vidarbha Cricket Association Stadium, Jamtha, Nagpur, 12 March 2011
Opponents – South Africa. Result – Lost. Batting – First
1st batch – 88 from 78 balls. Strike Rate – 112.82
2nd batch – 12 from 14 balls. Strike Rate – 85.71
3rd batch – 11 from 9 balls. Strike Rate – 122.22
Total – 111 from 101 balls.
Conclusion – A 100 in a losing cause for quite some time, India once again made the same mistake of going too early and losing wickets in a heap – with Tendulkar’s wicket again coming at a crucial time. South Africa made full advantage of it and prevented the hosts from running away with something bigger. A bigger decrease in the strike rate during the 90s but again more or less matching the career strike rate. This was his 99th International 100….
Bangladesh v India
Shere Bangla National Stadium, Mirpur, 16 March 2012
Opponents – Bangladesh. Result – Lost. Batting – First.
1st batch – 83 from 114 balls. Strike Rate – 72.80
2nd batch- 17 from 24 balls. Strike Rate – 70.83
3rd batch – 14 from 9 balls. Strike rate – 155.55
Total – 114 from 147 balls.
Conclusion – First up, let me get all the negative vibes out of the way. This, by far, is his slowest 100: at least from 2001 anyway. And it was pretty evident that once he got into the 70s and 80s, he sensed an opportunity to finally get rid of the monkey (which had by now grown wings and had become a lion-tailed macaque) and had probably put himself above the team in search for that 100.
But, judging him and calling him selfish on this innings is totally uncalled for. He recognised the need to get it out of the way and did use up balls. Granted and I will give you that. But calling him selfish amongst other things on ONE innings is Idiocy of the highest order.
For people who have decided to go ahead and call him names because of the way he has used up the last year, you may or may not have a point. (I myself called him selfish, but let us all give him the next 4-6 months to see whether he still remains motivated, whether the pressure was keeping him from performing or whether he is just prolonging his career for the sake of playing and nothing else).
Aggregated Numbers and Strike Rates from 2001 July:
No of centuries: 21.
Winning; 12
Tied: 1
Lost: 8.
Twenty-one 100s have come in the last 10 years and a bit to go with the 28 he struck in the first ten years of his decade (actually zero from 1989 to 1994 and then 28 during his first peak from 1994 to 2001). The winning percentage is 57.14 % and the losing percentage 38.09.
So the theory that India loses whenever Tendulkar scores a century is a false one and goes right out the window. An even more interesting aspect about Tendulkar’s losing contributions is that India lost only 6 times during his first 28 ODI hundreds – Interesting because the Indian team from 1994 to 2001 were more or less poorer to the side from 2001 till now.
If all his ODI 100s are taken into consideration, the losing percentage falls down drastically to 28%.
Strike Rates:
From 0-85 (median): Balls Faced – 1869. Runs Scored – 1801. Strike rate: It is a staggering 96.36 per every 100 balls faced – up almost 10 runs from his career strike rate.
From 85-100: Balls Faced – 313. Runs Scored – 290. Strike Rate: 92.65. There is an improvement of almost 6 runs per ever 100 balls on his career strike rate but there is also a small decrease of 4 runs from his 96 runs per every 100 balls during this phase.
I don’t know whether the overall and the one yesterday can be taken in isolation just because the century against Bangladesh helped him to get to something – something definitive. But while this century does reveal the fact that he perhaps put himself before the team, one incident doesn’t tarnish the reputation that he has built over the last two decades.
That’s about that for this column. Sometime in the future, I will try and look at whether Tendulkar’s slowed down in the 90s ergo resulting in him getting out in the 90s rather than stepping on and going to convert it into three figures.
P.S. This clearly shows that generally he doesn’t go out there just to look for 100s (as the strike rate of 92.65 very clearly shows). It also shows that having a fairly reasonable losing percentage of 28%, he is not really India’s unlucky man.

Looking for fast live cricket scores? Download CricRocket and get fast score updates, top-notch commentary in-depth match stats & much more! 🚀☄️