
'%20x='0'%20y='0'%20height='100%25'%20width='100%25'%20xlink%3Ahref='data:image/jpg;base64,/9j/2wBDAAYEBQYFBAYGBQYHBwYIChAKCgkJChQODwwQFxQYGBcUFhYaHSUfGhsjHBYWICwgIyYnKSopGR8tMC0oMCUoKSj/2wBDAQcHBwoIChMKChMoGhYaKCgoKCgoKCgoKCgoKCgoKCgoKCgoKCgoKCgoKCgoKCgoKCgoKCgoKCgoKCgoKCgoKCj/wgARCAAGAAoDASIAAhEBAxEB/8QAFgABAQEAAAAAAAAAAAAAAAAAAAYH/8QAFQEBAQAAAAAAAAAAAAAAAAAABAX/2gAMAwEAAhADEAAAAMdvAd3/xAAhEAACAQMDBQAAAAAAAAAAAAABAwIABBEFBhIIEyFR0v/aAAgBAQABPwDa7o3sLazuVcw9kV8+5IYyfQp/TpuMuYV6powhnxks+K//xAAXEQEAAwAAAAAAAAAAAAAAAAABAAIh/9oACAECAQE/AKus/8QAGREAAgMBAAAAAAAAAAAAAAAAAQIABCJB/9oACAEDAQE/ALWEQA8n/9k='%3E%3C/image%3E%3C/svg%3E)

Details under the eight columns of a batsman’s career record are the most rudimentary and the most often seen batting statistic in the game of cricket. These numbers are memorized, romanticized about and quoted endlessly in discussions about the game in general and batting in particular.
But what is given little thought is whether these numbers fit into certain generalities. Do we, as fans of the game, give any serious or even passing thought to know?
For instance, while many would remember Bradman’s batting average but few would be able to tell what was the percentage of his career runs in innings where he scored more than 50 (90% - the highest ever) and what effect it had on pushing his batting average to as high as it ended at. The question we need to ask ourselves is: Keeping Bradman aside, depending upon batting order number and average etc, do decently long and successful batting careers lay themselves out in a pattern.
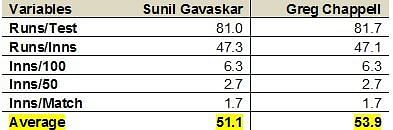
I have often been fascinated at the similarity between the career numbers of Greg Chappell and Sunil Gavaskar. Not on the aggregates but on parameters like the one listed for Bradman above. They have roughly the same number of runs per test, runs per innings, innings per century, and innings per match but yet still they ended with different averages. What explains the difference is the number of not outs Chappell had being a middle order batsman (19 in 151 innings) than Gavaskar (16 in 214 innings), who was an opener, which helped boost his average.
This, and the subsequent analysis is not a judgment call on pointing out the best batsmen, but to state that it is an exciting and informative exercise to look at batting numbers in a different manner and deduce some thumb rules which would help read summary career numbers better than most of us do now. This article doesn’t aspire to be a revelation, but a simple, descriptive analysis of what’s visible to us fans on an everyday basis.
For this analysis, I have considered top (Nos 1-3) and middle order (Nos 4-7) batsmen with more than 3000 career runs. The resultant sample size is 179 batsmen spanning across all eras. England and Australia constitute almost 45% of these players (79), followed by West Indies (24) and India (21). The colonial triumvirate that dominated the sport for more than a century is pre-eminent amongst the sample considered.
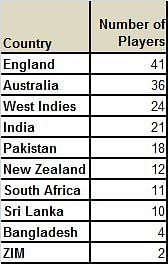
Table 2: Number of batsmen from each team
I was tempted to classify no.7 batsmen as lower order batsmen but the likes of Gilchrist, Boucher, and Kapil Dev, with hefty runs at that position, made me consider the no.7 batsman as a middle order position.
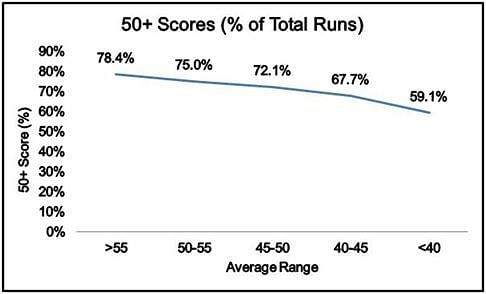
The proportion of career runs scored in innings of 50+
It has been mentioned in the initial paragraphs that Don Bradman scored more than 90% of his career runs in innings where he scored more than 50. And as is usual for records that Bradman holds, the next best batsman/number is left some distance behind.
In this case, Bradman is followed by a distant Joe Root (80.86%) and former West Indian batsman Everton Weekes (80.36%). These are the only three batsmen to have scored more than 80% of their runs in scores of 50 plus. (Within the considered cut-off)
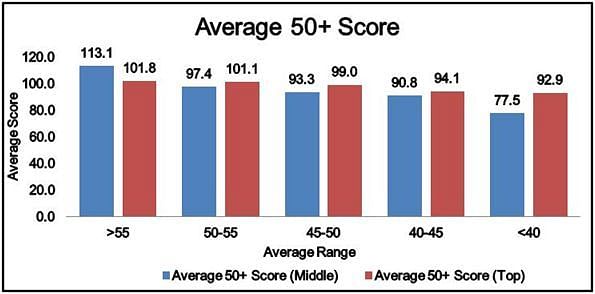
The overall findings are also fairly intuitive. As any casual follower of the game would know, the higher the batsman’s average, more are the percentage of runs he is likely to have gotten in 50+ scores. What the graph also gets to show is that a batsman with an average of more than 45 is likely to have scored more than 70% of his career runs in 50+ scores.
But are these proportion also dictated, one must ask, by the number of a batsman in the batting order?. As one would expect, a top order batsman is more likely to bat for longer and thus, score more runs. It would be pertinent to see the percentages bifurcated further into the top and middle order batsmen, and see if top order batsmen skew the number higher up and vice versa.
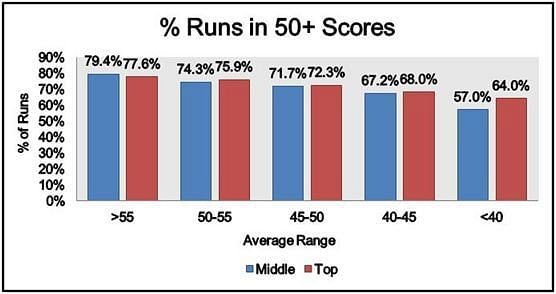
The answer is; not by much. As hinted earlier, batsmen with an average of more than 50 would, regardless of the batting position, score around 72-73% of their career runs in 50+ scores. But a telling observation can be made in the <40 average bucket, where top order batsmen have a significantly higher percentage than middle order batsmen.
This shows that top order batsmen, especially with lower averages, are likely to score a higher % of 50+ scores than middle order batsmen, due to the virtue of them getting to bat for longer.
But are there any exceptions here?
Yes; Saeed Anwar, for instance, has a percentage of 79.96% and still has an average of only 45.5. Amongst the 11 batsmen who have a percentage of more than 78, his average is the lowest followed by Doug Walters (48.26) and Frank Worrell (49.48).
Saeed Anwar’s case can be partly attributed to him being an opening batsman and having remained not out only 2 times in the 91 innings he batted in, which kept his average relatively low.
The Case of Not Outs
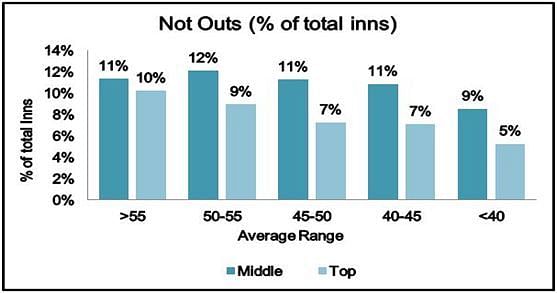
It has become clear from the Gavaskar-Chappell and Saeed Anwar examples that as a trade off for getting to bat higher up the order, top order batsmen forgo a higher probability of not being dismissed. As the chart explains, middle order batsmen (across all average ranges) on an average have a higher proportion of not out innings than top order batsmen.
Anwar’s case is an exception here too, for had he remained not out in 7% of his total innings instead of only 2%, his average would have been approx 48. This also helps explain the cases of Shiv Chanderpaul and Steve Waugh here. Being middle order batsmen, they had a very high proportion of not outs (18% and 19% respectively), which pushed their average up a fair notch.
Saeed Anwar’s low overall average is also explained by his lower propensity to score big scores. For a top order batsman, he scored a surprisingly low average of 90 runs every time he crossed fifty (this is arrived at by dividing the total runs scored in innings of 50+ runs by the number of such innings, in this case, it is 3240/36=90)
Shiv Chanderpaul’s case brings to the fore another conundrum; Chanderpaul took more than 3 years to register his first test hundred and at the conclusion of his 51st test, had still only scored 2 centuries. Although his conversion rate (converting 50s to 100s) improved drastically from there on; but his overall conversion rate remained low (31%), and much like Saeed Anwar he also scored a relatively lower (avg) 88 runs in his 96 fifty plus innings.
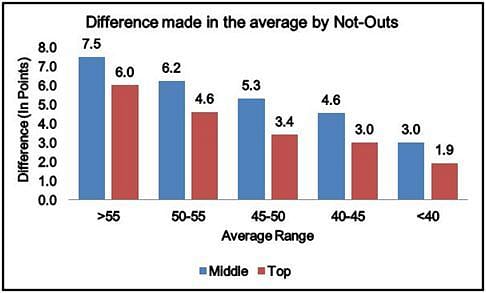
This explains that higher the proportion of not outs for a batsman, greater will be the difference made to his average, even with a lower conversion rate and lower average 50+ score.
This is more likely to favour middle order batsmen more, as shown in the graph below. For instance, Chanderpaul scored 42.4 runs per innings (11867/280), but 49 not outs push his final average up by 9 points to 51.37 (11867/231).
For his average range in the middle order, a very high proportion of not outs (18%) made a 45% higher difference to his overall average (8.99/6.2=1.45), the same number for Saeed Anwar is 0.99 (45.52-44.53=0.99).
Chanderpaul and Anwar’s case compels us to look at what is the average score that batsmen score in all 50+ innings. It is intuitive/obvious, that top and middle order batsmen with 50+ averages would score have a higher average score, but are there any details that need be looked into concerning a positive correlation between conversion rate and average 50+ score.
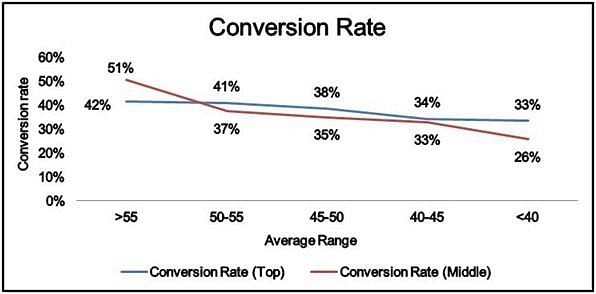
Graphs 5 & 6 illustrate the obvious; higher the conversion rate for a batsman, higher would be the average 50+ score. Also, the numbers for top order batsmen are more consistently spread across average ranges than middle order batsmen, and the gap for the respective orders in the <40 range is once again brought to the fore here and reinforces the trade off mentioned earlier; between a higher conversion rate and average 50+ score, and lower not outs.
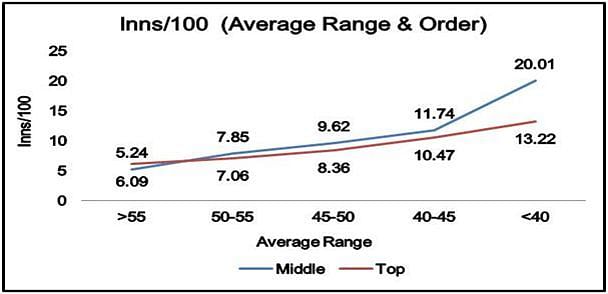
Talking about the average 50+ score, we have to bring in another number into consideration; the number of innings per century.
Taking Saeed Anwar’s case again; he took a relatively higher number of innings per hundred (91/11=8.3) for an opening batsman, which kept his average 50+ score lower and thus reduced his average. As the graph brings out, batsmen averaging higher usually take lesser number of innings to register a hundred. Batsmen averaging more than 50 usually score a hundred once every 7 innings and those who score big hundreds are likely to have a higher average.
Conclusion
Summary career numbers can tell us a lot more not only about the player but also the strength of team he played for. Before making a judgment call on any batsmen, it would be useful to stare at these numbers for they convey a lot.
Take Viv Richard’s case for example, for a top/middle order batsman, Viv only played 1.5 innings per test (182/121) which is perceptibly low and at par with middle/lower middle order batsmen.
But this is not just any number, what it does is that it conveys the strength of the West Indian team in that for the 121 tests Richards played as a part of that dominant unit, they only had to bat in the second innings in half of those tests.
Similarly, Chanderpaul and Steve Waugh’s case with not outs is not just a commentary on their careers but also on the teams that they played for. Chanderpaul, being the only good batsman in his team for a long time had to bat time and hold an end more often, and he would usually see wickets tumbling all around him. Steve Waugh, who also rescued Australia from many trenches, also played a similar role for his team.
This analysis is not to point out at who the better batsmen have been over the years, nor is it meant to be a yardstick for performance measurement. It has been done to facilitate discussion on why and how did careers fan out the way they did. On how good has the job been done here, I would be eager to know.

Looking for fast live cricket scores? Download CricRocket and get fast score updates, top-notch commentary in-depth match stats & much more! 🚀☄️