

'%20x='0'%20y='0'%20height='100%25'%20width='100%25'%20xlink%3Ahref='data:image/jpg;base64,/9j/2wBDAAYEBQYFBAYGBQYHBwYIChAKCgkJChQODwwQFxQYGBcUFhYaHSUfGhsjHBYWICwgIyYnKSopGR8tMC0oMCUoKSj/2wBDAQcHBwoIChMKChMoGhYaKCgoKCgoKCgoKCgoKCgoKCgoKCgoKCgoKCgoKCgoKCgoKCgoKCgoKCgoKCgoKCgoKCj/wgARCAAGAAoDASIAAhEBAxEB/8QAFgABAQEAAAAAAAAAAAAAAAAAAAYH/8QAFQEBAQAAAAAAAAAAAAAAAAAABAX/2gAMAwEAAhADEAAAAMdvAd3/xAAhEAACAQMDBQAAAAAAAAAAAAABAwIABBEFBhIIEyFR0v/aAAgBAQABPwDa7o3sLazuVcw9kV8+5IYyfQp/TpuMuYV6powhnxks+K//xAAXEQEAAwAAAAAAAAAAAAAAAAABAAIh/9oACAECAQE/AKus/8QAGREAAgMBAAAAAAAAAAAAAAAAAQIABCJB/9oACAEDAQE/ALWEQA8n/9k='%3E%3C/image%3E%3C/svg%3E)

Globalization also, for obvious reasons, meant that clubs saw an unprecedented increase in the number of football fans. In line with other strategies, they needed to provide these fans with a live-game experience, if and when they came to the stadiums. The number of fans had outgrown the capacity that an old stadium could provide clubs with. Subsequently, a few teams moved to new stadiums, citing expansion in terms of seating capacity and ambition as a reason.
While it’s difficult to quantify the importance of fans and the atmosphere they create, or the historical significance that certain games have had and the memories that come with it, examples of two Premier League teams and their transition can help consolidate the indisputable impact supporters and other similar external factors can have on a club’s proceedings.
West Ham was one of the clubs that relocated to a new home stadium in the recent past. They played their last game at Upton Park on 10th May 2016, the place that had been their home for 112 years. Let that sink in. A hundred and twelve years. Multiple generations of families made priceless memories on that very ground. Fixed match-day rituals for many. It’s easy to imagine football being a sun for these fans, the central figure, everything else revolving around it.
No wonder their last season turned out as it did. They comprehensively outperformed their statistics. To add more clarity to the aforementioned claims, one needs to be acquainted with the realm of ‘expected’ stats. xGD or expected Goal Difference piggybacks on the concept of expected goals (xG).
Simply put, xGD is the expected Goal Difference for a team based on the number of goals they were ‘expected’ to score minus the number of goals their opponents were ‘expected’ to score. Put another way, each shot they or their opponents took was given an xG rating that told us about the probability of that shot ending in the back of the net.
Over the entire course of the season, the xG of every shot they took, was added up to give their xG for the season (say A). Similarly, the xG of each shot their opponents took was added up (say B). A - B is nothing but the xGD metric
In the 2015/16 season, West Ham finished with an Actual Goal Difference (AGD) of 14 but the xGD metric put them on a goal difference of -1.08. The net difference between their Actual Goal Difference (AGD) and their Expected Goal Difference (xGD) was a staggering 15.08 (this number is of prime importance here, calculated like this: AGD-xGD or 14 - (-1.08) = 15.08).
That difference of 15.08 was the largest difference for any team in the EPL that season.
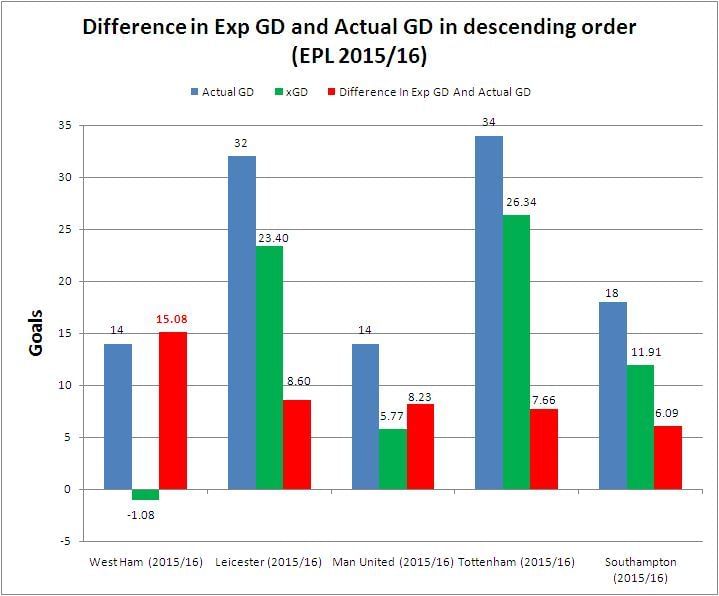
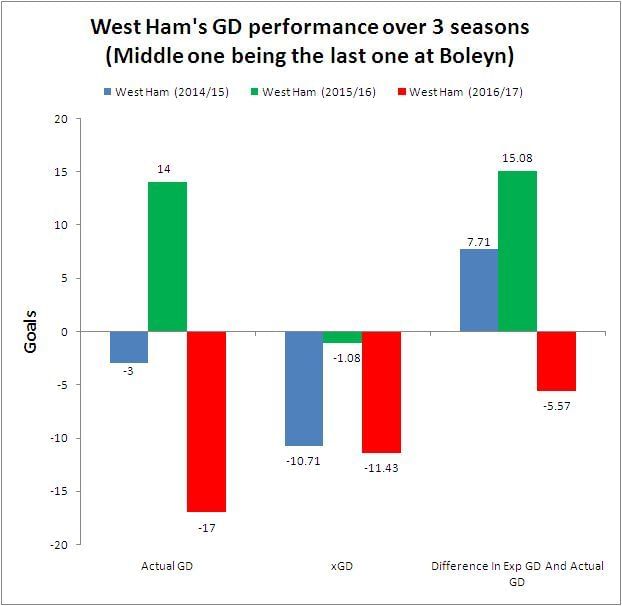
In short, West Ham scored more and conceded fewer than they should have, by a difference of more than 15 goals. If you were to put that down to player quality instead of the gravity of it being their last season at the historic ground, there’s something else you need to know. Their next season, i.e. their first season in their new home, they ended with a net difference (AGD-xGD) of -5.57 goals.
That means they scored fewer and conceded more (i.e. they underperformed), the opposite of the previous season. So the difference between the two seasons, one at Boleyn Ground and the other at the London Stadium was stark. It was a difference of more than 20 goals (15.08 - (-5.57) = 20.65 goals). And this difference cannot be solely attributed to players as the core squad members over these two seasons were more or less the same.
If there was a points table based on points collected at home in the EPL, West Ham would have finished 7th in their last season at Boleyn Ground and finished 16th in their first at the London Stadium.
The chart below contrasts West Ham’s last season at Boleyn Ground to the one before it and the one after it. Clearly, the green bars stand out as the anomaly, not the norm.
The same anomaly is observed when it comes to Tottenham Hotspur as well. Tottenham replaced their old stadium with the new ‘Tottenham Hotspur Stadium’. In their last season at White Hart Lane, Tottenham had the best home record out of all the 20 PL teams.
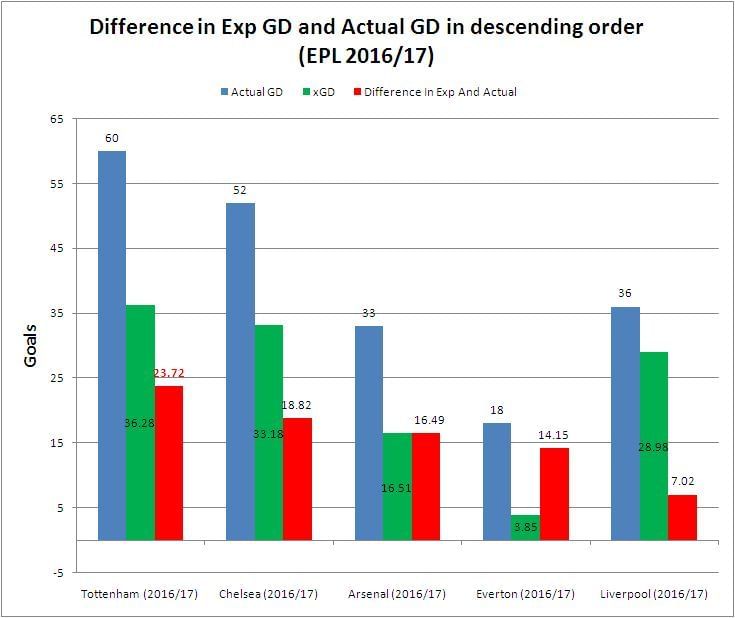
They didn’t lose a single game at home, but these stats can be a little misleading. In that season, Tottenham had an Actual GD (AGD) of 60 goals but were expected (xGD) to have a GD of 36.29. The net difference is a whopping 23.71 (AGD-xGD).
That is to say, they scored more and conceded fewer goals than they should have, by almost 24 goals, the highest by any PL team that season.
Out of the 100 instances of a Premier League team in the seasons from 2014-19 (20 teams per season, for 5 seasons, therefore 20*5=100), the total of 23.71 is 2nd highest. This means that only one ever team, in the last 5 seasons, outperformed their xGD by a larger margin than Tottenham did in that season.
(Side Note: If a team were to underperform their xGD stats, their net value would have been negative, instead of the positive (23.71) that Tottenham and West Ham (15.08) had in their respective season)
While in the 2016/17 season Tottenham finished with the highest points at home by any team in the PL, they came 5th in the same table in the next season.
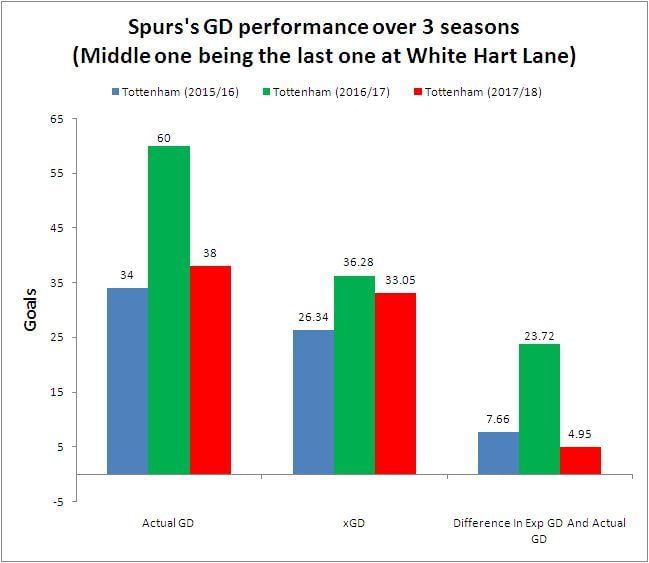
As illustrated with West Ham over 3 seasons, the chart below contrasts Tottenham’s performances over 3 seasons (15/16, 16/17 and 17/18). The green bars represent their last season at White Hart Lane. As is evident, Tottenham regressed to a closer representation of their expected GD value in their first season at their new home ground.
As shown above and as is obvious to the naked eye, fans are the heart and soul of a club. Fans, as well as the nostalgic moments created with them in historic stadiums, are of great importance to any club. Supporters augment the player’s performances in the good times and mitigate it when they falter in their results by cheering the team on, as long as they don’t falter in their commitment to the cause.
While the role of the supporters in a sporting team's success cannot exactly be quantified by numbers as it depends on several variables, club's need to realize the importance of the fans and the above statistical data is conclusive proof that many haven't done so yet.
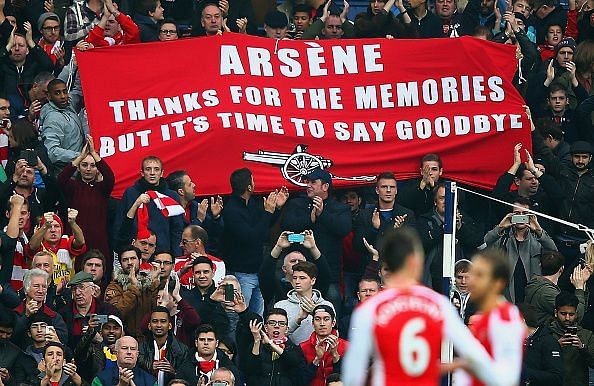
Arsenal Football Club, much to the dismay of their fans, have been at the forefront of this unfortunate movement. Lack of communication and organisation from the board’s end has resulted in the shambolic current state that the club is in. Mikel Arteta’s cannot be another band-aid appointment. The fans expect more, even deserve more. They were overlooked and marginalised by the club and have been asking for more ever since the dusk of Arsene Wenger’s and Unai Emery’s tenure.
Two joint statements later, Arteta looks the likely victim of the lack of foresight by the people controlling the reigns of the club. In all probability, it looks like he will suffer for the mistakes his predecessors made but isn’t that always the case anyway?
Stats source: www.understat.com
