

'%20x='0'%20y='0'%20height='100%25'%20width='100%25'%20xlink%3Ahref='data:image/jpg;base64,/9j/2wBDAAYEBQYFBAYGBQYHBwYIChAKCgkJChQODwwQFxQYGBcUFhYaHSUfGhsjHBYWICwgIyYnKSopGR8tMC0oMCUoKSj/2wBDAQcHBwoIChMKChMoGhYaKCgoKCgoKCgoKCgoKCgoKCgoKCgoKCgoKCgoKCgoKCgoKCgoKCgoKCgoKCgoKCgoKCj/wgARCAAGAAoDASIAAhEBAxEB/8QAFgABAQEAAAAAAAAAAAAAAAAAAAYH/8QAFQEBAQAAAAAAAAAAAAAAAAAABAX/2gAMAwEAAhADEAAAAMdvAd3/xAAhEAACAQMDBQAAAAAAAAAAAAABAwIABBEFBhIIEyFR0v/aAAgBAQABPwDa7o3sLazuVcw9kV8+5IYyfQp/TpuMuYV6powhnxks+K//xAAXEQEAAwAAAAAAAAAAAAAAAAABAAIh/9oACAECAQE/AKus/8QAGREAAgMBAAAAAAAAAAAAAAAAAQIABCJB/9oACAEDAQE/ALWEQA8n/9k='%3E%3C/image%3E%3C/svg%3E)
Batsman Value (Wins)
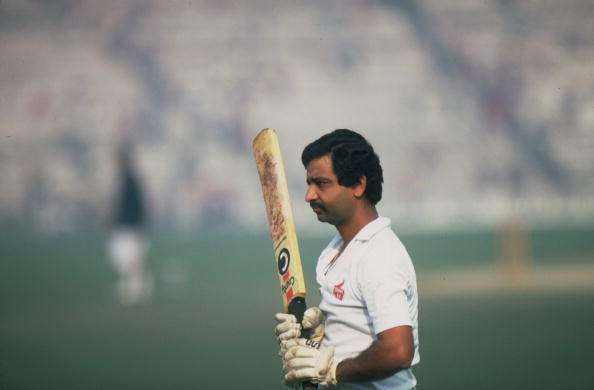
None of Gundappa Viswanath’s 14 test centuries were in a losing cause, Viswanath replacing Gavaskar shouldn’t be any surprise to those who know this fact. There is a strong case for Dilip Vengsarkar to be counted in the same breath as Gavaskar as well, since it was solely on his back that India was winning matches in the 1980s (2.65), briefly during which he was also the most prolific batsman in the world.
Sachin Tendulkar had the company of Mohammad Azharuddin and Vinod Kambli as pivotal match-winners, which reduced his overall value and similar is the case with Cheteshwar Pujara (2010s).
Rahul Dravid’s claim as the momentum changing batsman during the 2000s gets a string boost as he emerges with a high-value factor (1.20) especially when seen in the light of the fact that there were other great names (Tendulkar, Laxman, Sehwag) in the fray.
Decade | Player Name | Mtchs | Runs | Ave | Following Batsman | Runs | Best/Next Best Average | Avg | Prolificacy Factor | Efficacy Factor | Value Factor |
1950s | V.Mankad | 5 | 563 | 112.6 | P.Umrigar | 371 | V.Hazare | 121 | 1.52 | 0.93 | 1.41 |
1960s | MAK Pataudi | 9 | 705 | 44.1 | A.Wadekar | 507 | A.Wadekar | 63 | 1.39 | 0.70 | 0.97 |
1970s | G.Viswanath | 16 | 1359 | 50.3 | S.Gavaskar | 1124 | S.Gavaskar | 45 | 1.21 | 1.12 | 1.35 |
1980s | D.Vengsarkar | 10 | 895 | 74.6 | S.Gavaskar | 547 | M.Amarnath | 46 | 1.64 | 1.62 | 2.65 |
1990s | S.Tendulkar | 18 | 1362 | 59.2 | M.Azharuddin | 1336 | V.Kambli | 74 | 1.02 | 0.80 | 0.82 |
2000s | R.Dravid | 39 | 3810 | 74.7 | S.Tendulkar | 3163 | R.Dravid | 75 | 1.20 | 1.00 | 1.20 |
2010s | C.Pujara | 17 | 1551 | 64.6 | S.Tendulkar | 1421 | VVS Laxman | 94 | 1.09 | 0.69 | 0.75 |
The bowler charts corroborates the claim that Anil Kumble was the biggest match-winner of the 1990s, his exploits on home surfaces were a stuff of legends and his factor brings it out clearly given that India registered all but 1 of its wins during this period at home.
Ravichandran Ashwin’s exploits on home surfaces and against relatively weaker oppositions has pushed his numbers into the elite league. But a win is a win, and winning against a weaker opposition is also a characteristic of a strong team.
Overall | Player Name | Mtchs | Wkts | Ave | Following Bowler | Wkts | Bowler | Avg | Wkts Factor | Ave Factor | Overall Factor |
1950s | V.Mankad | 5 | 41 | 13.32 | S.Gupte | 22 | Jasu Patel | 11.94 | 1.86 | 0.90 | 1.67 |
1960s | E.Prasanna | 6 | 40 | 17.83 | B.Bedi | 25 | B.Nandkarni | 14.00 | 1.60 | 0.79 | 1.26 |
1970s | B.C'Shekhar | 12 | 86 | 18.31 | B.Bedi | 72 | E.Prasanna | 17.41 | 1.19 | 0.95 | 1.14 |
1980s | Kapil Dev | 11 | 49 | 18.0 | N.Hirwani | 29 | M.Singh | 11.25 | 1.69 | 0.63 | 1.06 |
1990s | A.Kumble | 17 | 126 | 17.05 | V.Raju | 57 | J.Srinath | 18.38 | 2.21 | 1.08 | 2.38 |
2000s | H.Singh | 31 | 175 | 21.55 | A.Kumble | 162 | A.Kumble | 20.07 | 1.08 | 0.93 | 1.01 |
2010s | R Ashwin | 18 | 124 | 18.20 | P.Ojha | 78 | R.Jadeja | 15.59 | 1.59 | 0.86 | 1.36 |
India has come a long way since Lala Amarnath registered the first test hundred by an Indian. Players have broken records, ripped bowling attacks apart, and defied them to the brink of helplessness. While India has established an undeniable reputation as a cricket superpower, it is yet to tick some pivotal boxes which would springboard it into an equally formidable force against all opposition.
For now, let’s just celebrate those who have helped us believe in a future of such daring expectations.
India’s subsequent decline in away performances from 2010 onwards is not a typically Indian trait, only 2 teams have had a W/L ratio of more than 1 during this period. Also, the W/L ratio in away matches in the ongoing decade for major test playing nations (excl. Zim and Ban) is .648, which is the third worst for any decade after 1990s and 1980s.
Filtering the period in consideration to start from 2013, the ratio plummets to.0.421, providing further fuel to the debate on doctoring pitches to gain an undue home advantage.
Performance Summary (Away Matches)
Team/Decade | 1930s | 1940s | 1950s | 1960s | 1970s | 1980s | 1990s | 2000s | 2010s |
Played | 4 | 8 | 19 | 16 | 30 | 39 | 39 | 56 | 40 |
Won | 0 | 0 | 0 | 3 | 6 | 3 | 1 | 19 | 10 |
Lost | 3 | 5 | 9 | 13 | 12 | 12 | 15 | 19 | 18 |
Drawn | 1 | 3 | 10 | 0 | 12 | 24 | 23 | 18 | 12 |
W/L Ratio | 0.00 | 0.00 | 0.00 | 0.23 | 0.50 | 0.25 | 0.07 | 1.00 | 0.56 |
In any case, what has been the defining feature of India’s performance overall is the gap between its performances at home and abroad, which was the narrowest in the ‘Ganguly Era’ (2000s). That was a decade when India registered wins in Australia, England, West Indies, Pakistan and New Zealand.
In fact, had the ‘Sydney fiasco’ taken a different turn, the decade would have gone by as one where India didn’t lose any rubber outside of the sub-continent (Except New Zealand, 2002/03, West Indies 2002/03 and Pakistan 2006), the only such instant in its history.
This was also a decade where India’s famous batting line-up was in its full bloom, and the results showed in the form of India registering scores of 400 plus more often than it did during any other decade (26% of total innings). Easier wickets and better batsmen offer part of the explanation for this number, but there can be no debate around the fact that the 2000s was a decade India achieved the most satisfying results across all performance indicators.
Decade | 1930s | 1940s | 1950s | 1960s | 1970s | 1980s | 1990s | 2000s | 2010s |
Total Innings (Away) | 8 | 15 | 37 | 32 | 56 | 68 | 66 | 100 | 75 |
400+ scores | 0 | 0 | 2 | 2 | 9 | 9 | 13 | 26 | 16 |
% | 0% | 0% | 5% | 6% | 16% | 13% | 20% | 26% | 21% |

Follow IPL Auction 2025 Live Updates, News & Biddings at Sportskeeda. Get the fastest updates on Mega-Auction and cricket news