
'%20x='0'%20y='0'%20height='100%25'%20width='100%25'%20xlink%3Ahref='data:image/jpg;base64,/9j/2wBDAAYEBQYFBAYGBQYHBwYIChAKCgkJChQODwwQFxQYGBcUFhYaHSUfGhsjHBYWICwgIyYnKSopGR8tMC0oMCUoKSj/2wBDAQcHBwoIChMKChMoGhYaKCgoKCgoKCgoKCgoKCgoKCgoKCgoKCgoKCgoKCgoKCgoKCgoKCgoKCgoKCgoKCgoKCj/wgARCAAGAAoDASIAAhEBAxEB/8QAFgABAQEAAAAAAAAAAAAAAAAAAAYH/8QAFQEBAQAAAAAAAAAAAAAAAAAABAX/2gAMAwEAAhADEAAAAMdvAd3/xAAhEAACAQMDBQAAAAAAAAAAAAABAwIABBEFBhIIEyFR0v/aAAgBAQABPwDa7o3sLazuVcw9kV8+5IYyfQp/TpuMuYV6powhnxks+K//xAAXEQEAAwAAAAAAAAAAAAAAAAABAAIh/9oACAECAQE/AKus/8QAGREAAgMBAAAAAAAAAAAAAAAAAQIABCJB/9oACAEDAQE/ALWEQA8n/9k='%3E%3C/image%3E%3C/svg%3E)

There are many Top 10 lists of ODI batsmen on this website, almost all of them are great lists too, then why the need for another? you might ask.
This list is different because it uses statistics to make a learned prediction. This attempts:
a. To project what the young greats of the game who are still halfway through their careers might achieve over the full span of their career.
b. To estimate what the old legends would have achieved if they had played ODIs more frequently.
The factors that are chosen for the evaluation are:
- Total Runs Scored
- Career Batting Average
- Career Strike Rate
Pretty straightforward these factors, but with adjustments to reflect the full potential of the players involved.
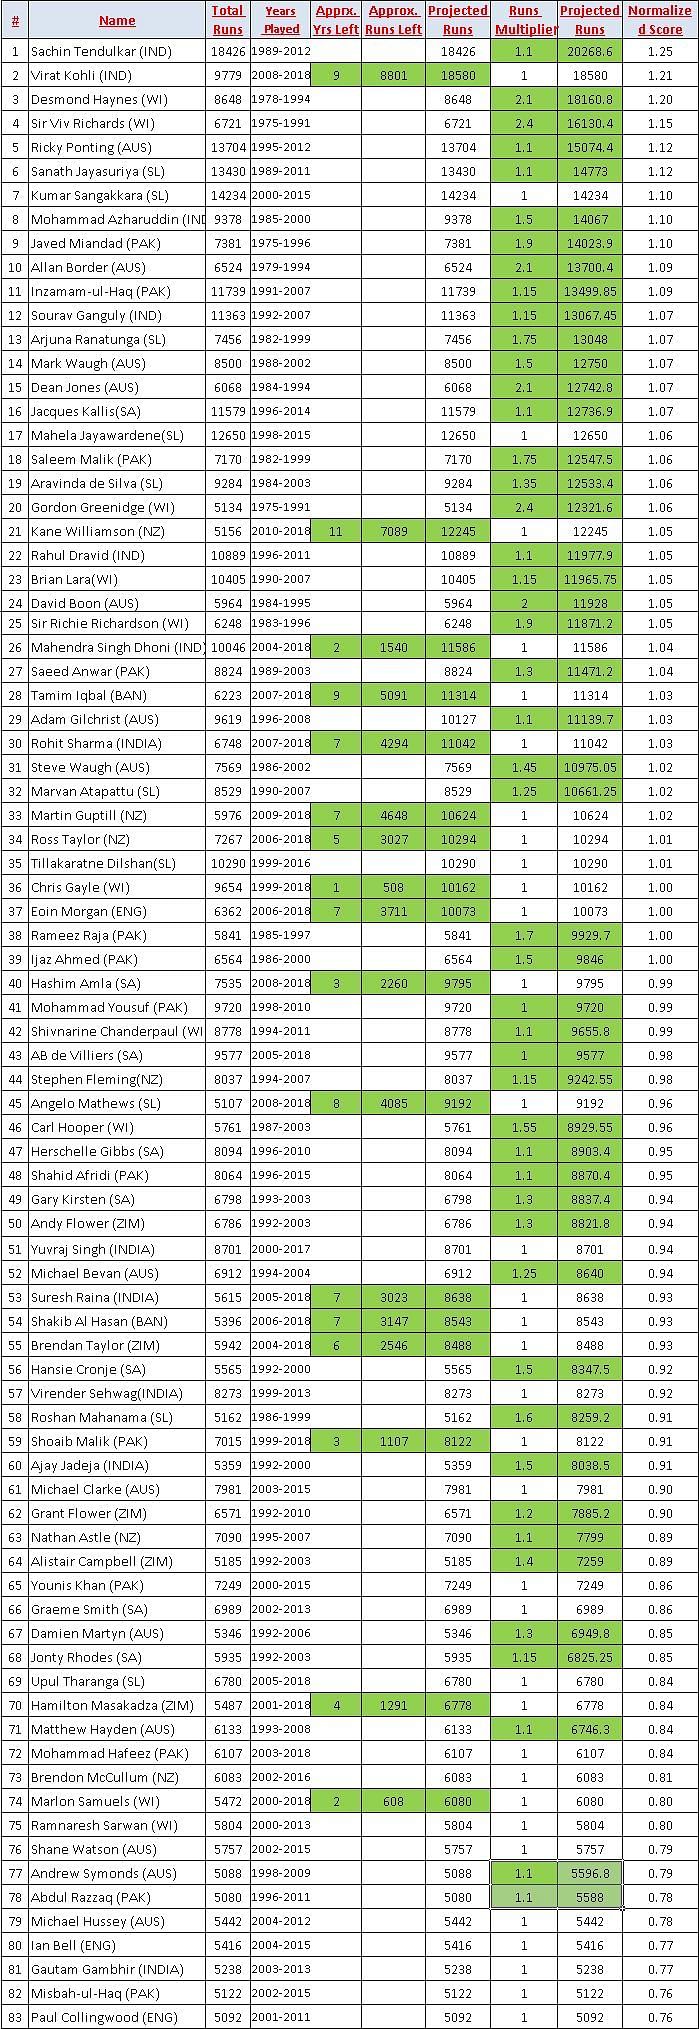
Total Runs Scored
A player of high caliber definitely gets to play more matches and thus scores more runs, it seems easy, right? But there are a couple of problems with that.
- A brilliant young player who is currently playing, and has many years left in his career, obviously hasn't scored as much as the giants who have retired after playing for a couple of decades.
- Legendary players of the old did not get to play as frequently as ODIs are played these days.
We have made a couple of adjustments to the stats so that there is some balance in the list.
- We have added runs into the account of young players based on how they have performed in the past and how many years are left in their career. 38/39 seems to be the number that most modern batsmen are retiring at. We will use that in our calculations
- Based on the decade a batsman played most of his ODIs, we will adjust the numbers by multiplying his runs with a suitable multiplier.
The table below lists the number of ODIs played in each decade since the beginning of ODIs
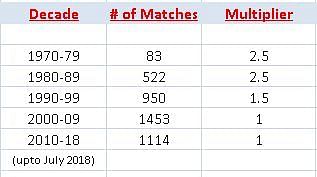
From the table above, it is evident that there were fewer ODIs played before 1990, to make up for that, the batsmen will have their runs multiplied by a maximum of 2.5 and a minimum of 1, depending on the decade they played most of their matches. Reference multiplier number is given in the table, different players will have their corresponding run multiplier between 1 and 2.5 depending on the years they played cricket.
Criteria: Batsmen with a minimum aggregate of 5000 ODI runs are selected for the evaluation.
Normalization: We have normalized the final total runs to a score of around 1. A batsman with a total of 10000 runs will get a score of 1, while the batsman with 5000 runs will get a score of 0.75, Sachin Tendulkar, the highest run-scorer in ODIs will get a score of 1.25. The indention for normalization is to minimize the effect of runs on the total score, so that runs do not hugely matter while we are assessing the quality of a batsman.
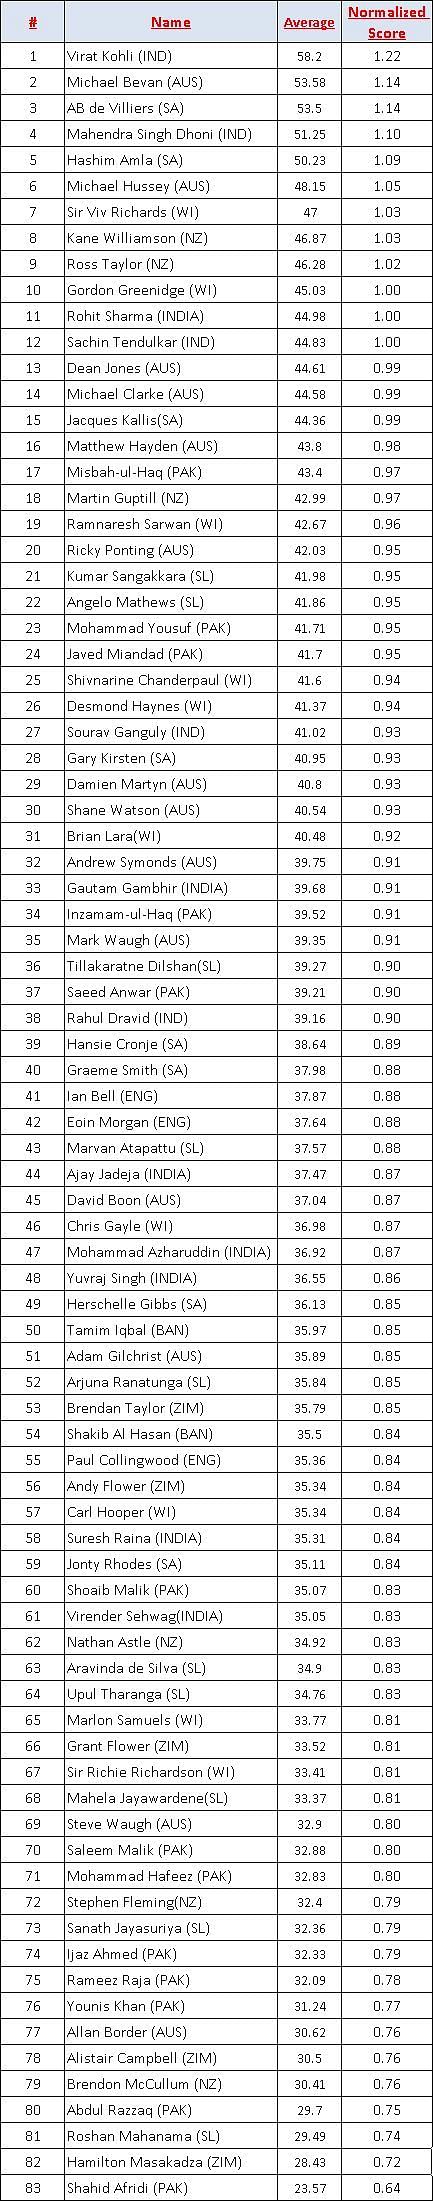
Career Batting Average
Higher career average is a sign of a better batsman. Higher averages reflect a higher number of centuries, frequency of high scores, consistency.
Normalization: An average of 45 will have a normalized score of 1, while an average of 60 will have a score of 1.25 and 0.75 will be the score of average 30.
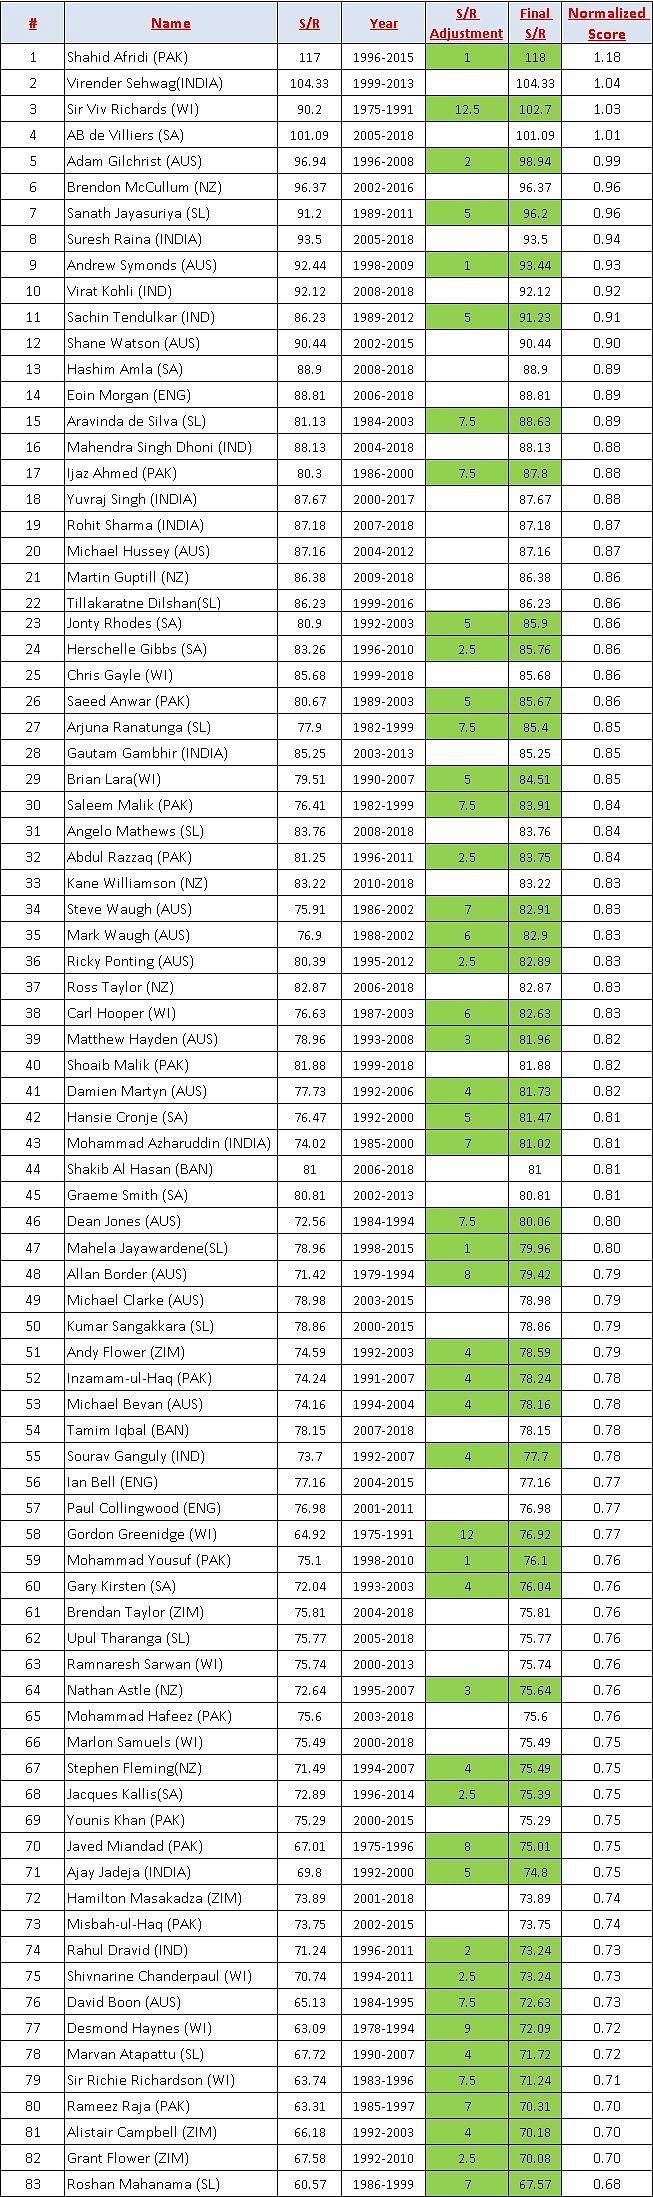
Career Strike Rate
A high strike rate does matter in ODIs, it makes all the difference between winning and coming close.
Adjustments: The game has evolved over the time, A total of 250 was deemed defendable, many years ago, nowadays even a total of 350 is not deemed safe score. With the introduction of T20s, the game has picked up the pace, the new rules are batsman friendly. We will add corrective Strike Rates(S/R) for players of the old era based on the decade they played. A player who played most of his matches between 1970-79 will get an additional S/R of 15, similarly, players who played most of their matches between 1980-89, 90-99 will get additional S/R of 10,5 respectively.
Normalization: 100 is the standard strike rate, Final strike rate after adjustment is divided by 100 to get the normalized score.
Final 50 Top ODI batsmen of all time
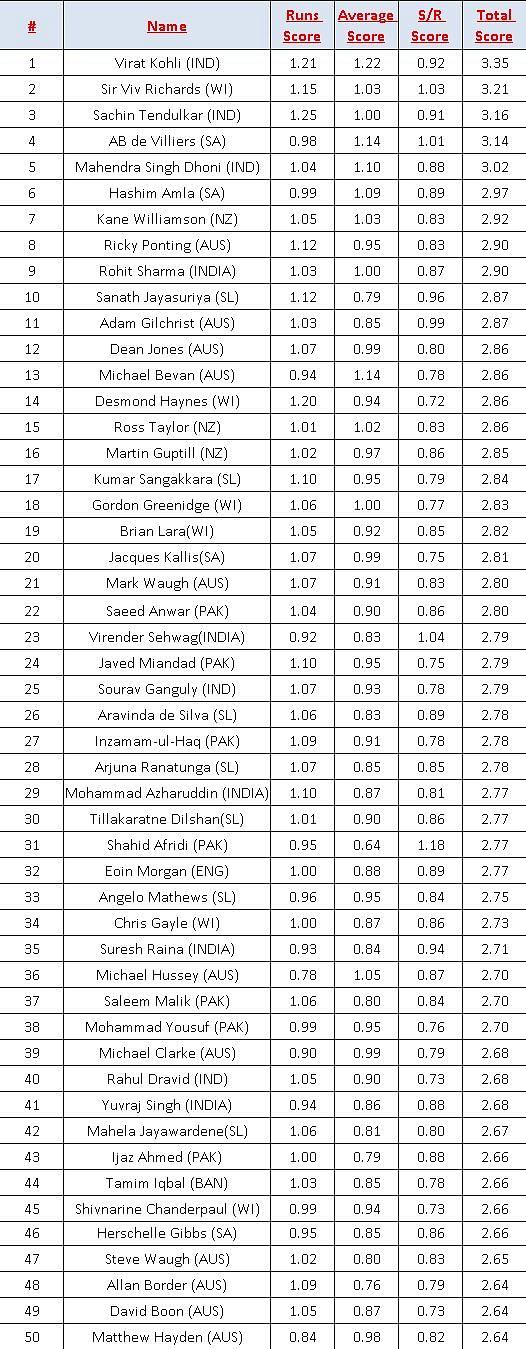
We have given equal weight to Runs, Average & Strike Rate. This has thrown in some surprises up and down the order. But when it comes to the Top 10, it is required of them to fulfil all these criteria equally. We believe that Top 10, in particular, are pretty good.
Do you agree with the final list? Would you have used a different methodology? Let us know in the comments section.

Follow IPL Auction 2025 Live Updates, News & Biddings at Sportskeeda. Get the fastest updates on Mega-Auction and cricket news