
'%20x='0'%20y='0'%20height='100%25'%20width='100%25'%20xlink%3Ahref='data:image/jpg;base64,/9j/2wBDAAYEBQYFBAYGBQYHBwYIChAKCgkJChQODwwQFxQYGBcUFhYaHSUfGhsjHBYWICwgIyYnKSopGR8tMC0oMCUoKSj/2wBDAQcHBwoIChMKChMoGhYaKCgoKCgoKCgoKCgoKCgoKCgoKCgoKCgoKCgoKCgoKCgoKCgoKCgoKCgoKCgoKCgoKCj/wgARCAAGAAoDASIAAhEBAxEB/8QAFgABAQEAAAAAAAAAAAAAAAAAAAYH/8QAFQEBAQAAAAAAAAAAAAAAAAAABAX/2gAMAwEAAhADEAAAAMdvAd3/xAAhEAACAQMDBQAAAAAAAAAAAAABAwIABBEFBhIIEyFR0v/aAAgBAQABPwDa7o3sLazuVcw9kV8+5IYyfQp/TpuMuYV6powhnxks+K//xAAXEQEAAwAAAAAAAAAAAAAAAAABAAIh/9oACAECAQE/AKus/8QAGREAAgMBAAAAAAAAAAAAAAAAAQIABCJB/9oACAEDAQE/ALWEQA8n/9k='%3E%3C/image%3E%3C/svg%3E)

Why would one really care about one-sided contests? I often wonder. Every Test match fan knows the charm associated with close finishes but do the terribly uneven contests have something in them worth appreciating? Or are these contests meant to be statistical highlights and nothing more?
As I dug deeper into some of the most uneven Test series (4-5 match series only) since 1970, I realized that there are many more nuances worth considering. A Test series in which a team ends up winning every match is often termed a whitewash. Now, which of the whitewashes in the period considered was the heaviest drubbing?
The winning margin in each of the matches, while being an extremely important factor, can never provide the complete picture. Many Test series remain evenly contested for a while before a single partnership, flurry of wickets or even a freak catch change the whole complexion.
The analysis of these whitewashes also reveals the dominant phases of the winning teams and the struggles the losing team went through in the same period.
The series selected for the analysis are quite well known. For fans of the winning team, they remain crown jewels among their Test victories. On the other hand, supporters of the losing side like to forget these displays as quickly as they can and think of them as an aberration.
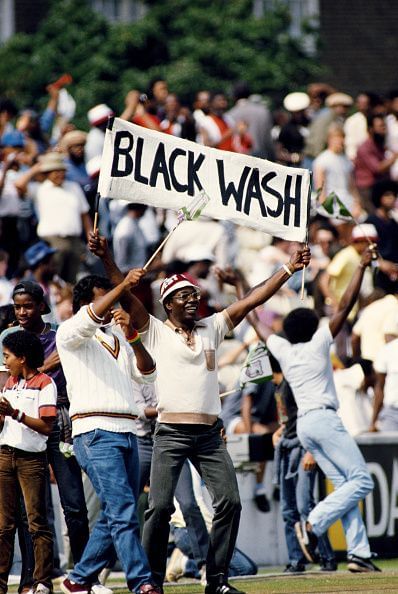
South Africa’s mighty team before the apartheid ban inflicted a crushing 4-0 defeat on a fairly strong Bill Lawry’s Australian team who were undoubtedly a little tired after a long tour of India. West Indies, who remained unconquered for 15 years in their heyday, dealt England two of their most humiliating series losses in the mid-1980s. The first of them, which came in 1984, being the only ‘blackwash’ (a term coined as a tribute to this great side) in an away series.
There has been no bigger pain for Test cricket fans in the last two decades than witnessing the extraordinary fall of West Indies. From a world-beating outfit for much of the 1980s until the mid-1990s, the team came apart almost spectacularly resulting in three whitewashes in 1998 (South Africa), 2000 (Australia) and 2004 (England).
Australia bounced back from an unexpected series loss in the 2005 Ashes to crush England in the 2006-07 series. In between this whitewash and Australia’s 5-0 win in the 2013-14 Ashes, there were three other series – India were blanked by England and Australia in 2011 while Australia themselves, going through a transition phase, were handed a 4-0 loss in the 2013 series in India.
How have I tried to analyze these series? There are multiple parameters that provide us with a view of how ‘heavy’ the heaviest series losses have been. These include,
1. Margin of wins in the Tests – This gives us an excellent understanding of the way the series transpired. Some have been close in the beginning but quickly turn completely in favour of the winning team after a particular match. In most cases, I shall also provide a deeper analysis of the specific game to help understand the series-defining moment(s).
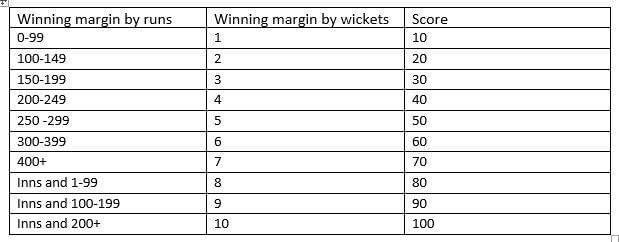
I have attached a particular weight to the margin of victory and averaged out the score across the series. For example, a win by 88 runs falls in the bracket 0-100 runs and gets 10 points. If the win in the next match is by 9 wickets, then the score for the second match is 90 and the average for the 2 matches is (10+90)/2 = 50. Since this factor is the major indicator of the dominance of the winning team, I give this a weight of 50%.
2. Average difference – This factor quite clearly captures the gulf between the two sides. I consider the difference in batting average (runs per wicket) between the winning team and the losing team. This factor gets a weight of 15%.
3. Wickets difference – In the 1984-85 series in the Caribbean (not part of this list), West Indies beat Australia 3-0 in the five-match series. What sets this win apart is the fact that West Indies never lost a single second innings wicket in the entire series. The number of wickets lost in the series is a good indicator of the difference in quality between the two teams in the series. I give this factor a weight of 5%.
4. Centuries difference – Often, in these one-sided series, we find that the triumphant team has had starts and fifties converted into big scores while the losing team struggles to do so. Although Test matches are won by bowlers, batsmen have to set them up. The difference in the number of centuries points to the batting strength in the series. This factor gets a weight of 5%.
5. 5-fors difference – The beauty of Test matches lies in the fact that a team cannot win if they don’t pick up 20 wickets. If a bowler or two go on and pick up five wickets in an innings, the team is well placed to wrap up the win. Many series, especially the one-sided ones, can be understood much better by analyzing the difference in five-fors between the two teams. This factor gets a weight of 5%.
6. 100+ partnerships difference – Partnerships are the key is a cliché in Test match commentary. When one analyzes these one-sided series, it becomes apparent that 100+ stands are often the difference in the end. This factor gets a weight of 5%.
7. Win-loss record of the opposition – Not all wins are equal. Similarly, not all whitewashes are equal. Beating West Indies in their pomp was something teams would aspire to. In contrast, not beating them in every Test match now would be considered an underachievement. I consider the win-loss ratio of the opposition team three years leading to the start of the series to help provide a better picture of the quality of the opposition the winning team was up against. This factor gets a weight of 5%.
8. Home-away win – Winning away is always more challenging than doing so in familiar home conditions. It is way harder to win every Test of an away series. This factor, deservedly, gets 10% weight.
Analysis of whitewashes
The factors used for analysis are all normalized and weighed before being plotted on the graphs. Outliers are avoided by setting caps.
Factor 1 - Margin of wins
When we analyze the margin of wins, the West Indies' wins over England in the mid-1980s come out on top. The lowest scores in the ten wins have been 30 and 40. This clearly goes on to illustrate the extent of dominance across the two series in 1984 and 1985-86.
It must be mentioned, however, that England actually were in a position of strength in the 2nd Test of the 1984 series in Lord’s. David Gower’s confident declaration left West Indies with a daunting chase of 344 in slightly over 70 overs. However, Gordon Greenidge made a mockery of the target with an unbeaten 214 and ended every hope England had of making this a contest. The series was never close after that game.
In the third position is India’s win over a struggling Australian outfit in the 2013 series. This is followed by Australia’s win over a weak West Indian team in 2000 and England’s triumph at home against a fairly strong Indian team in 2011. Again, in this case, India were well in the series when a Stuart Broad hat-trick in the 2nd Test left them shaken. They never really recovered from this and went on to lose the next two Tests by heavy margins. The bottom two on this list (SA versus WI in 1998 and the Ashes in 2013-14) had fairly close matches but the home team pulled through in every case.
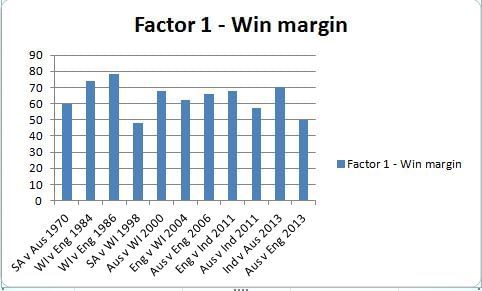
Factor 2 – Average difference
Surprisingly, India’s twin capitulations in England and Australia in 2011 come out on top in this analysis (34.21 and 28.48 respectively). While they did go to Australia after a crushing loss to England a few months earlier, the abject surrender in England was indeed a shock.
The next two spots are taken by Australia’s Ashes win in 2006 (26.42) and West Indies’ win in 1986 (21.52). In the last two positions are South Africa’s 1998 win over West Indies (14.8) and India’s 2013 win at home against Australia (17.91).
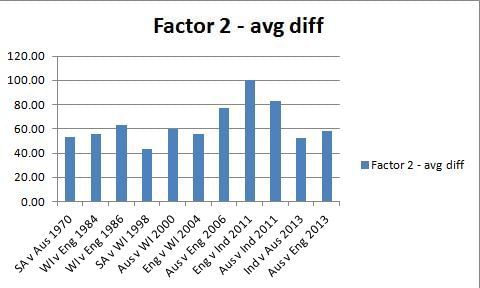
Factor 3 – Wickets difference
In the 1985-86 win in the Caribbean, West Indies lost just 55 wickets in 9 innings while England lost all 100 wickets in their 10 innings. The wickets difference, in this case, is the highest (45) among all the series considered. In second and third place are Australia’s Ashes win in 2006 (39) and their 2000 win against WI (38). Two of the closest in this analysis are England’s 2004 win over West Indies (21) and South Africa’s win over Australia in 1969-70 (13).
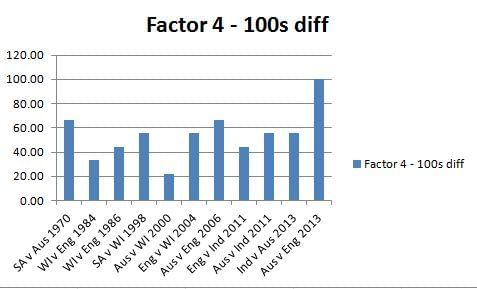
Factor 4 – 100s difference
One of the biggest problems England had in the 2013-14 Ashes was the inability to convert starts. Australia, on the other hand, made merry and their batsmen scored 10 centuries in the series. The difference in the number of centuries between the two teams (9) is the highest among the series considered. In joint second position are SA v Australia in 1970 and Australia in the 2006 Ashes (6 each). The lowest difference in centuries scored is Australia in their 2000 series win against WI (2).
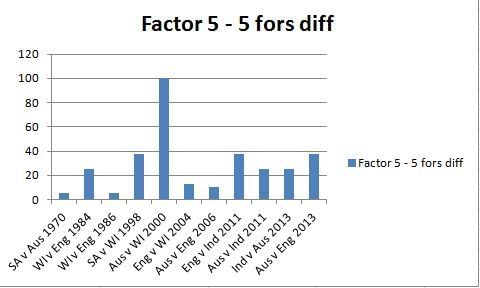
Factor 5 – 5-fors difference
This is an interesting factor to analyze. The top spot goes to Australia in their win over West Indies in 2000 with the five-fors difference of 8. This clearly showcases the difference in class between the two bowling outfits. Glenn McGrath, who picked up a remarkable 10/27 in the Perth Test in the same series, led an outstanding bowling unit while West Indies were without any of their leading fast bowlers. The second spot is shared by three series (SA-Aus 1970, England v India 2011 and the Ashes 2013) with the five-fors difference of 3 in each case.
The SA-Australia 1970 series and the 1986 West Indies-England series saw the losing team register more five-fors. Perhaps the best way of interpreting this is that the winning team had a more balanced attack while the losing team was relying heavily on a bowler or two.
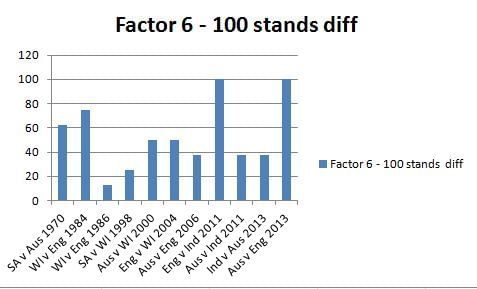
Factor 6 – 100+ partnerships
In this factor, the top spot is taken by England-India 2011 and the Ashes series in 2013-14 (difference of 8 each). In second and third spot respectively are WI versus England in 1984 and SA-Aus in 1970 with differences of 6 and 5. At the bottom of this list is the SA-WI series in 1998 with a difference of just 2.
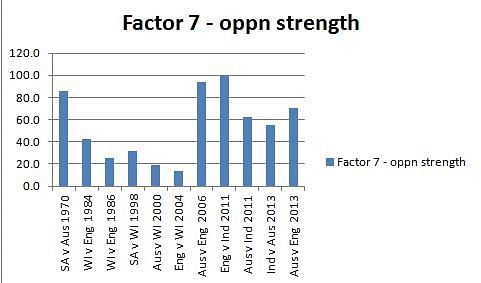
Factor 7 – Opposition strength (win-loss ratio)
While all other factors measure the difference between the two sides throughout the series, this factor actually helps us understand how big an achievement the whitewash truly was. When the win-loss ratio of the opposition team (losing team) leading up to the series is analyzed we get to know the form with which the team entered the contest.
India had quite a successful run before being stopped dead in their tracks in 2011 in England. On the other hand, West Indies had a woeful record leading up to their thrashing in Australia in 2000. In fact, England’s win in 2011 comes out on top in this analysis (win-loss ratio of 3.2 for India) while Australia’s Ashes win in 2006 (W/L ratio of 3 for England) and South Africa’s win in 1970 (W/L ratio of 2.75 for Australia) are in second and third spots respectively.
Not surprisingly, perhaps, given West Indies’ decline, the lowest on the list are England v West Indies in 2004 (0.44) and Australia versus West Indies in 2000 (0.6).
Factor 8 – home v away performance
The West Indies win in England in 1984 is remarkable for a number of reasons. None, perhaps, is as significant as the fact that it was done away from home. Every other whitewash was achieved in home conditions.
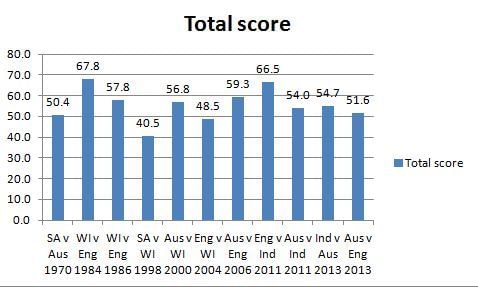
Overall analysis
In the overall analysis (combining all 8 factors), the West Indies' win in England in 1984 deservedly comes out on top. The ‘blackwash’ was the perhaps the best achievement during the West Indies’ reign at the top of the cricketing world.
England’s complete dominance of India in 2011 comes a close second, followed by Australia’s 2006 Ashes win and West Indies’ 1986 win against England. More finely balanced contests meant that South Africa’s win in 1970 and Australia’s Ashes triumph in 2006 have lower overall scores.
The bottom two, however, are England’s win over WI in 2004 (48.5) and South Africa’s series win against WI in 1998 (40.5).
Working on this analysis provided a close look at the relative strengths of teams going into the series, the pivotal moments that swung the contest and the gulf in quality during the series. While these contests may not feature on the highlight reel when one looks back at Test series over the last three decades, they certainly provide a great understanding of teams’ highs and lows in Tests.
Follow IPL Auction 2025 Live Updates, News & Biddings at Sportskeeda. Get the fastest updates on Mega-Auction and cricket news