
'%20x='0'%20y='0'%20height='100%25'%20width='100%25'%20%0A%20%20%20%20%20%20%20%20%20%20xlink%3Ahref='data:image/jpg;base64,/9j/2wBDAAYEBQYFBAYGBQYHBwYIChAKCgkJChQODwwQFxQYGBcUFhYaHSUfGhsjHBYWICwgIyYnKSopGR8tMC0oMCUoKSj/2wBDAQcHBwoIChMKChMoGhYaKCgoKCgoKCgoKCgoKCgoKCgoKCgoKCgoKCgoKCgoKCgoKCgoKCgoKCgoKCgoKCgoKCj/wgARCAAHAAoDASIAAhEBAxEB/8QAFQABAQAAAAAAAAAAAAAAAAAAAAX/xAAUAQEAAAAAAAAAAAAAAAAAAAAC/9oADAMBAAIQAxAAAACaGP/EACAQAAICAQMFAAAAAAAAAAAAAAECAwQABhESFyFBUdL/2gAIAQEAAT8AhqtqC+9VQYxARLsFHcAleOdNpfFsqPQhX6z/xAAcEQABAwUAAAAAAAAAAAAAAAACAAEDBBITUbH/2gAIAQIBAT8ArjwyWBpuL//EABgRAAMBAQAAAAAAAAAAAAAAAAEDEQAC/9oACAEDAQE/AEMovQu//9k='%3E%3C/image%3E%3C/svg%3E)
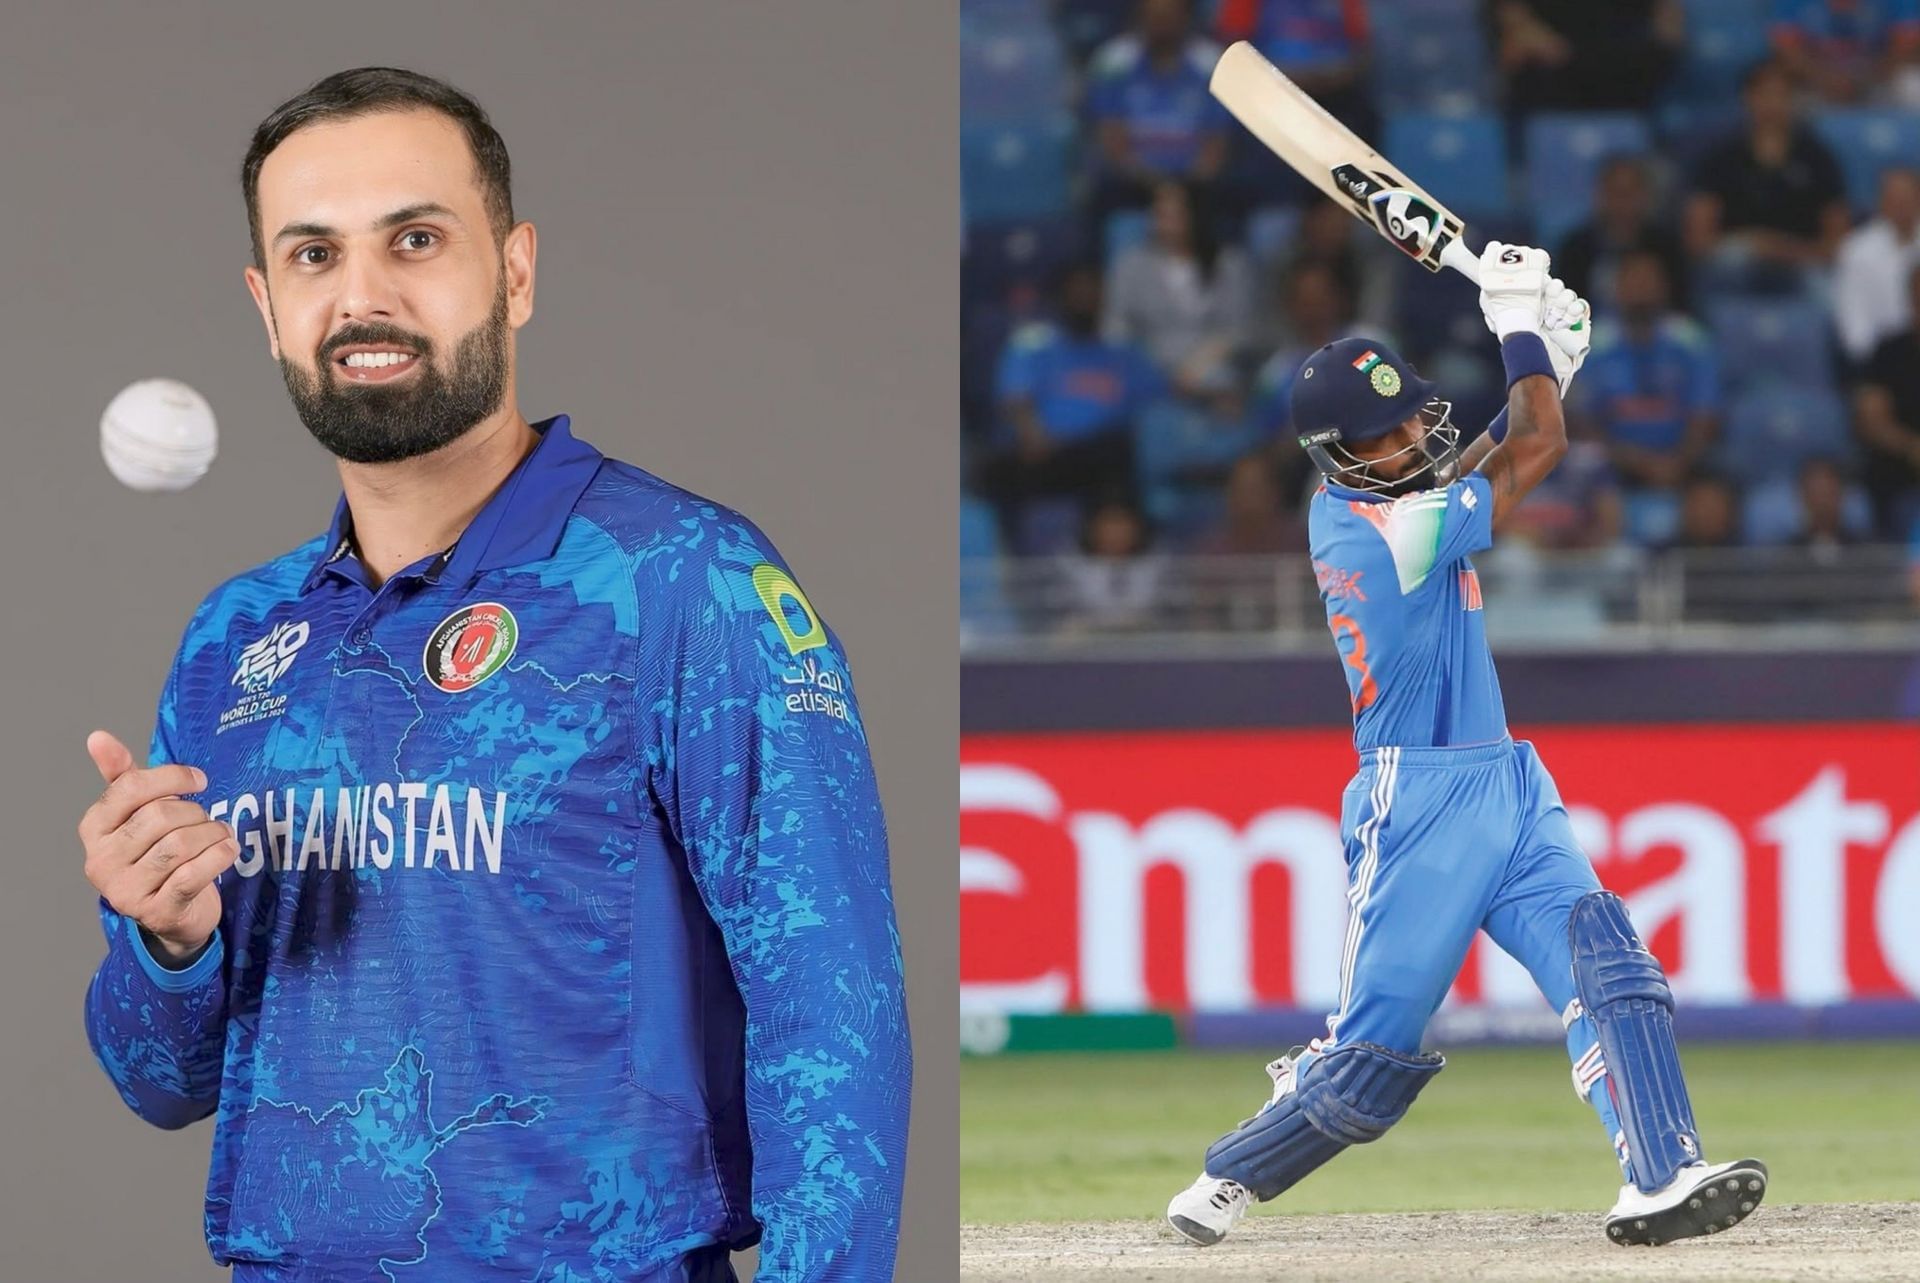
India’s Hardik Pandya and Afghanistan’s Mohammad Nabi currently occupy the top two spots in the ICC men’s T20I all-rounder rankings, sitting at No. 1 and No. 2 respectively.
Nabi was last seen in action against Sri Lanka during the Asia Cup 2025 on Thursday, September 18, in Abu Dhabi. He produced a blistering knock of 60 off just 22 balls, smashing three fours and six sixes, and also chipped in with the ball, returning figures of 1/20 in three overs.
Despite his all-round brilliance, Sri Lanka chased down 170 with six wickets to spare, ending Afghanistan’s campaign at the group stage.
Meanwhile, Hardik Pandya will feature later today (Friday, September 19) when India take on Oman in their final Group A clash in Abu Dhabi. Having already beaten the UAE and Pakistan, the Men in Blue have secured their place in the Super 4s. Hardik has so far taken one wicket in two games and hasn’t had a chance to bat.
With both Pandya and Nabi continuing to make their mark in T20Is, here’s a comparison of their records after 116 matches each in the format.
Comparison of Mohammad Nabi and Hardik Pandya’s stats after 116 T20Is
Batting stats
#1 Most runs
Afghanistan’s Mohammad Nabi has played 139 T20Is, scoring 2357 runs in 130 innings at an average of 22.44 and a strike rate of 136.55, with seven half-centuries to his name. Notably, in his first 116 matches, the veteran all-rounder amassed 1976 runs in 108 innings.
On the other hand, since making his debut in January 2016, India’s Hardik Pandya has featured in 116 T20Is, compiling 1812 runs across 90 innings.
#2 Average and Strike rate
Mohammad Nabi accumulated 1976 runs in his first 116 T20Is, averaging 22.45 with a strike rate of 138.96. During this stretch, he registered five half-centuries, with his best knock being a blazing 89 off 30 balls against Ireland at the Greater Noida Sports Complex in 2017.
Meanwhile, Hardik Pandya has scored 1812 runs in 116 matches, averaging 27.87 with a strike rate of 141.67. He has registered five fifties, with his best being an unbeaten 71 off 30 balls against Australia at the PCA IS Bindra Stadium in 2022.
#3 Runs in a winning cause
Out of Mohammad Nabi’s first 116 T20Is, Afghanistan emerged victorious in 70 matches. During this period, he scored 1418 runs in 62 innings at an average of 31.51 and a strike rate of 154.74, registering five half-centuries.
In contrast, Hardik Pandya has played 116 T20Is, with India winning 83 of those. In these games, the 31-year-old all-rounder has compiled 1210 runs in 60 innings, averaging 30.25 at a strike rate of 154.34, including three fifties.
Bowling stats:
#1 Most wickets
Mohammad Nabi has featured in 139 T20Is, picking up 102 wickets at an average of 27.86, a strike rate of 23.04, and an economy of 7.26, with best figures of 4/10. Notably, in his first 116 matches, the off-spinner claimed 88 wickets.
On the other hand, Hardik Pandya has taken 95 wickets in 104 innings across his 116-match T20I career.
#2 Average and Strike rate
In his first 116 T20Is, Mohammad Nabi claimed 88 wickets at an average of 28.60, a strike rate of 23.30, and an economy of 7.37, with best figures of 4/10.
Meanwhile, Hardik Pandya has taken 95 wickets at an average of 26.62, a strike rate of 19.38, and an economy of 8.24, with his best figures being 4/16.
#3 Performance in a winning cause
Mohammad Nabi was on the winning side in 70 of his first 116 T20Is, taking 63 wickets in 67 innings at an average of 23.70, a strike rate of 20.44, and an economy of 6.95, with best figures of 4/10.
In contrast, Hardik Pandya has been part of 83 victories across his 116-match career, claiming 81 wickets in 75 innings at an average of 21.73, a strike rate of 16.36, and an economy of 7.97, with best figures of 4/16.

Follow IPL Auction 2025 Live Updates, News & Biddings at Sportskeeda. Get the fastest updates on Mega-Auction and cricket news