

'%20x='0'%20y='0'%20height='100%25'%20width='100%25'%20xlink%3Ahref='data:image/jpg;base64,/9j/2wBDAAYEBQYFBAYGBQYHBwYIChAKCgkJChQODwwQFxQYGBcUFhYaHSUfGhsjHBYWICwgIyYnKSopGR8tMC0oMCUoKSj/2wBDAQcHBwoIChMKChMoGhYaKCgoKCgoKCgoKCgoKCgoKCgoKCgoKCgoKCgoKCgoKCgoKCgoKCgoKCgoKCgoKCgoKCj/wgARCAAGAAoDASIAAhEBAxEB/8QAFgABAQEAAAAAAAAAAAAAAAAAAAYH/8QAFQEBAQAAAAAAAAAAAAAAAAAABAX/2gAMAwEAAhADEAAAAMdvAd3/xAAhEAACAQMDBQAAAAAAAAAAAAABAwIABBEFBhIIEyFR0v/aAAgBAQABPwDa7o3sLazuVcw9kV8+5IYyfQp/TpuMuYV6powhnxks+K//xAAXEQEAAwAAAAAAAAAAAAAAAAABAAIh/9oACAECAQE/AKus/8QAGREAAgMBAAAAAAAAAAAAAAAAAQIABCJB/9oACAEDAQE/ALWEQA8n/9k='%3E%3C/image%3E%3C/svg%3E)
Empiricists and romanticists alike would agree that this year’s World Cup has been apathetic. It is yet to imbue the incredulity of the 1975 edition or the histrionics of the 1983 version. We haven’t seen any fairy tales as in the 1996 Wills World cup, nor have we seen the fierce clashes as seen in the 1992 Benson and Hedges World Cup.
The participants in this tournament are logically divided into three tiers. South Africa, Australia, India and New Zealand obviously occupy the topmost tier, with West Indies, Bangladesh and England falling into the second tier. The Associate nations are at the bottom while Sri Lanka and Pakistan have been left stranded in the uncertain cloud between Tier 1 and 2.
This has made the World Cup too predictable. Pundits predicted the tournament to end up with India, Australia, South Africa and New Zealand combating for the final two spots and what has come to pass is no different. Forget the early morning starts and the insipid clash between tycoons and raccoons, even the battles of the indomitable have been passionless.
This forced me to stride into the statistical world to pit World Cups against each other to find which is the most one-sided, monotonous edition was and I was not in for a surprise.
The method
To compare the competitiveness of each and every single edition, I made use of the Net Run Rate (NRR) for each game. How the NRR is calculated is discussed in this article.This method makes use of the two resources available for a team to score runs - wickets and balls – and extrapolates the existing stats to predict a final score for both the teams.
Then the difference between the scores are found and divided by the number of overs played to find the Run Rate. The difference between the Run Rates of the winning team and the losing team will result in the NRR of the match. The smaller the NRR, the closer the match is.
So NRR is inversely proportional to the competitiveness of a match for a bigger NRR would mean a larger margin of victory. As the competitiveness increases the NRR drops. So the index of competitiveness can be calculated by finding the reciprocal of NRR.Competiveness Index (CI) = 1/ NRR
*Matches that were won with a margin of less than 20 runs were considered as close games.
| Year | Average NRR in the World Cup |
|---|---|
| 1975 | 1.66 |
| 1979 | 0.99 |
| 1983 | 0.97 |
| 1987 | 0.91 |
| 1992 | 0.80 |
| 1996 | 1.26 |
| 1999 | 1.32 |
| 2003 | 2.08 |
| 2007 | 2.10 |
| 2011 | 1.73 |
| 2015 | 1.99 |
The competitiveness of each World Cup
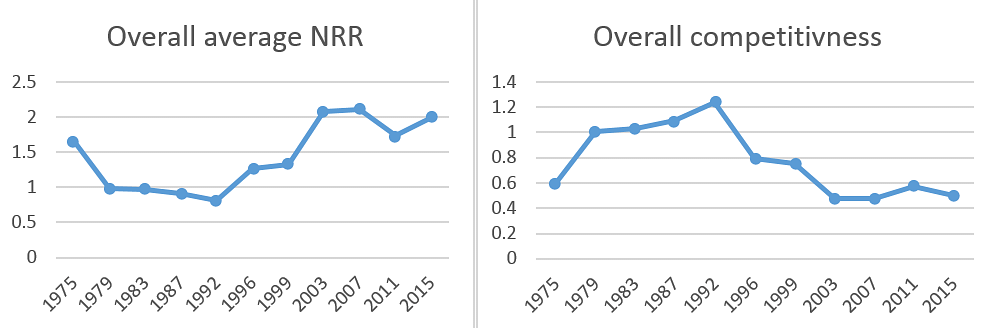
As evident from the graph, the average NRR for each World Cup has been going down from 1975 to 1992. The 1975 edition was the first Cricket World Cup ever played and included two associate teams - Sri Lanka and East Africa. Most teams were still new to the idea of limited overs cricket which resulted in some one-sided affairs. But since then, teams started adopting fast which resulted in the 1979 tournament being more competitive.
The most competitive of all was the 1992 World Cup and that does not come as a surprise given the quality of sides that participated in that tournament. South Africa, after their apartheid moratorium, entered the tournament as the ninth team. Sri Lanka were a much-improved side after a deplorable display in the previous tournaments.
Sri Lanka beat South Africa in the first leg and Zimbabwe caused a massive upset by beating the to-be finalists England. There were altogether 15 closely fought matches - the highest in any edition. Sri Lanka became the first team to chase down a target in excess of 300 and Australia defeated India by one run. The South Africans were humbled by the Lankans off the penultimate ball of the innings with just three wickets to spare and England beat India by just 9 runs.
Add to the statistics, the coloured clothing, day-night games and the white balls, the Benson and Hedges World Cup was the most exciting ever. The progress of competitiveness had a sudden slump as ICC decided to increase the number of participants by 12 in the 1996 World Cup, resulting in 4 weaker teams playing in the tournament.
Hence, some of the group stage games were one-sided, save for the upset Kenya caused against the West Indies. The trend would continue in the 1999 World Cup as well, and the use of Duke Balls exacerbated the issue.
Things getting worse
The number of participants in 2003 was increased to 14 resulting in more one-sided, lethargic games. To top everything off, teams started forfeiting games in Zimbabwe and Kenya resulting in victories for the two African teams on the basis of defaults. South Africa was knocked out of the first round and neither of England nor West Indies could make it into the Super Six round.
Kenya caused an upset against Sri Lanka but was trounced by all the other big teams but could still make it to the semi-final. The presence of Zimbabwe and Kenya begot a plethora of walkover victories to teams like Australia and India making the 2003 world cup the second worst in cricket history.
The 2007 World Cup was the worst and that is due to the shocking first round exit of both Pakistan and India. The tournament also included 16 teams, siring a lot of pushovers in the first leg. Teams like Bermuda, Canada and Scotland were of no match to the top tier nations. However, Ireland and Bangladesh caused an upset by beating Pakistan and India, respectively and measured up to the Super 8 round. Their fairytale could not extend as the other six teams found them to be softies.
Bangladesh, however, could beat South Africa but their show against the other teams was pathetic. Only 8 games were decided by a margin that was less than 20 runs and even the semi-finalists – South Africa, Sri Lanka and New Zealand – were beaten black and blue by the eventual winners Australia.
The successful 2011 World Cup managed to help cricket take a detour as the insidious downhill path of the competitiveness curve was stemmed and made to rise up, making it the oxygen for the resuscitation of ODI Cricket. Only 14 teams were allowed to participate and teams like Netherlands, Ireland, Bangladesh and Canada managed to live up to the standards of the big names.
Ireland beat England and Canada gave Pakistan a scare in the group stages. The good batting tracks ensured that even minnows could put up decent scores on the board giving the top sides a run for their money. There were 14 close games – the second highest after 1992 as England tied with India in Bangalore, Ireland beat England off the last over and Bangladesh romped home against the English side with just 2 wickets to spare.
The slump in 2015
The sudden surge however came crashing down in this year’s tournament as the average NRR is perilously closing on those of the 2003 and 2007 editions. Two new balls, big bats and the ludicrous fielding restrictions have made most of the games one-sided. The clamp down on chucking extremely close to the tournament undermined teams like Pakistan and West Indies and the result is blatantly plain.
Flat batting tracks have offered little for the bowlers and the teams packed with maverick, power-hitters are seemingly ruling the roost. Teams other than Australia, South Africa, New Zealand and, to an extent, India have failed to acclimatize to the new playing conditions which has lopsided the tournament. On paper, this is the third worst World Cup in contrast to the most competitive edition in 1992 which was played in the same venue.
If weaklings are ignored
A bearable argument is that the Associates have decimated the quality of the pinnacle tournament of ODI cricket. So, excluding the weaker teams in each World Cup produces the following results.
In 1975: Matches played by East Africa and Sri Lanka were excludedIn 1979: Matches played by Canada and Sri Lanka were excludedIn 1983: Matches played by Sri Lanka and Zimbabwe were excludedIn 1987: Matches played by Sri Lanka and Zimbabwe were excludedIn 1992: Matches played by Sri Lanka and Zimbabwe were excludedIn 1996: Matches played by Kenya, Netherlands, Zimbabwe and UAE were excludedIn 1999: Matches played by Zimbabwe, Scotland, Kenya and Bangladesh were excludedIn 2003: Matches played by Bangladesh, Zimbabwe, Kenya, Canada, Netherlands and Namibia were excludedIn 2007: Matches played by Bangladesh, Zimbabwe, Ireland, Netherlands, Kenya, Scotland, Canada and Bermuda were excluded.In 2011: Matches played by Bangladesh, Canada, Ireland, Netherlands, Kenya and Zimbabwe were excluded.In 2015: Matches played by Afghanistan, Zimbabwe, Scotland, Ireland and UAE were excluded.
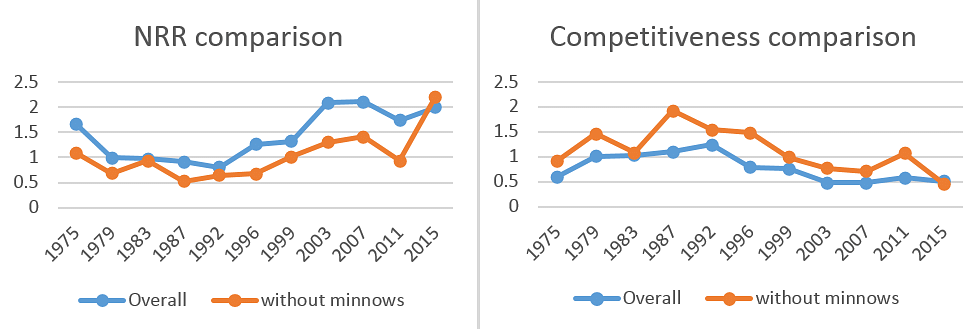
The only World Cup which does not seem to be afflicted by the presence of the Associate teams is the 1983 edition which had an average NRR of 0.971 and 0.932 with and without minnows respectively. It was during this World Cup, Sri Lanka managed to beat New Zealand and Zimbabwe pipped Australia to the post. There was a stark increase in competitiveness in the 1987, 1996, 2003, 2007 and 2011 World Cups when the minnows were neglected.
The failure of the 2015 edition to produce interesting cricket is laid bare by the fact the competitiveness drops further at the exclusion of the games played by the weaker teams. This shows that even the games between the stronger sides have been lacklustre.
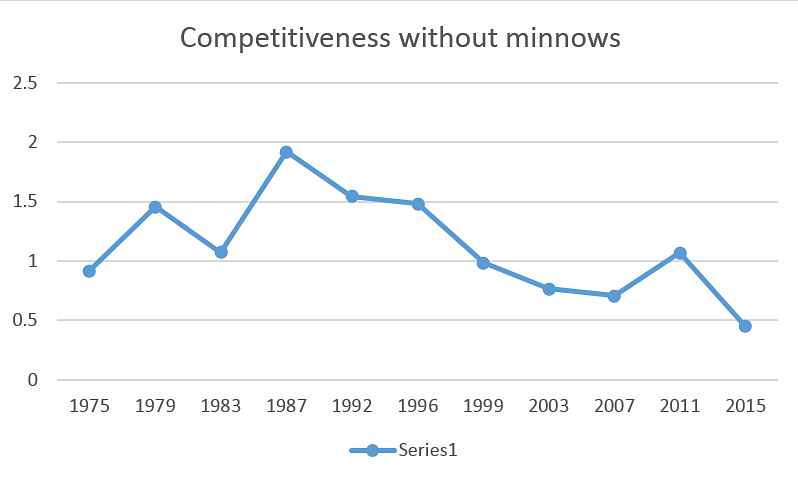
The competitiveness of this tournament, without the minnow teams has hit a new low making it the worst in the cricket history among the top-tier teams. Barring the games that included the weaker sides, only three games have been decided by a margin of less than 20 runs. Only in 1979 and 1975 were the numbers were as low as in 2015.
New Zealand vs. Australia was the only clash that went down to the wire while Bangladesh played two close games against England and New Zealand, winning the first and losing the latter.
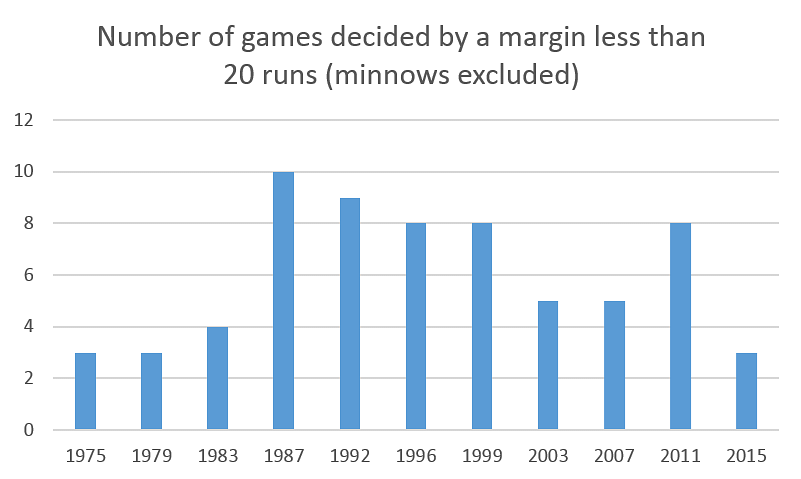
The ignominious fact about this World Cup is that the relatively weaker sides have produced closer encounters (8) than the stronger outfits (3). The average NRR of 2.207 is the worst NRR average recorded for a World Cup excluding the weaklings. Even if the semifinals and the final are to be decided by a margin of 1 run, the average NRR would fall down to 1.909, which would still be head and shoulders above the second worst average NRR of 1.414, recorded in the 2007 edition.

Pakistan lost their prime spinner Saeed Ajmal to ICC’s ambush on chuckers while West Indies financial frailties reflected in their performance. England are proving to be a pushover in limited overs cricket as they are constantly struggling to come out of their old school method of playing cricket.
Bangladesh showed a lot of heart in this World Cup but they, along with Zimbabwe are yet to become a significant threat to the stronger teams. Sri Lanka is clearly stuck to the past technique of going bonkers at the top in contrast to the modern technique of saving-wickets-to-launch-at-the-death.
This has left cricket with only four teams that can produce high-quality cricket. Even then, South Africa had a mediocre outing against India and India was found wanting against Australia in the tri-series that preceded the tournament. This is a serious issue that needs to be addressed since, the lopsided performances can shift the balance of power towards a handful of countries as seen in the early 70’s or at the worst could go on to hammer the final nail in the coffin for ODI cricket as a whole.
Conditions that would bring balance between both bat and ball, a revision on the preposterous fielding restrictions and a possible clamping down on the size of the bats could reinstitute the balance of cricket. The ICC should also review their revenue sharing model since the once-eminent teams like West Indies are slowly collapsing into abyss thanks to the lack of proper financing.

Looking for fast live cricket scores? Download CricRocket and get fast score updates, top-notch commentary in-depth match stats & much more! 🚀☄️