

Teams crave for home turfs to sneak past their opposition. Spin-heavy attacks desire for spitting cobras, a potential highway is dreamt of by batsmen and pacers would possibly want live green grass all over the turf to question the dancing skills of batsmen.
Overpowering an opposition at home is pretty much expected of all major cricketing nations. The challenge lies elsewhere. Matches hosted by neutral venues are very few, but those matches throw light on every aspect of the teams - their ability to play in unfavourable conditions, their level of flexibility as per the nature of the pitch.
Neutral venues equalise the winning percentages of both the competing sides and unlike home conditions, don’t shift the odds in favour of the host nation. Pakistan has a reason to be respected. In spite of playing on neutral venues, they attained the number 1 spot in Tests just a few months ago.
Stats don’t give the full picture, but digging into them will throw light on some insights of the adaptableness of the teams and its players at neutral venues. The following is a small piece of statistics of how teams fare on neutral wickets.
Australia
Australia have stamped its authority on all three formats at neutral venues. They have taken a liking to most oppositions through some gritty piece of cricket and they haven’t been a disappointment by any stretch of the imagination.
In the Test format, they have beaten the likes of South Africa and Pakistan - two powerhouses of world cricket. In ODIs, they have been even more glittering. With win percentages between 80 and 100, Australia has rolled over four oppositions namely Bangladesh, New Zealand, Zimbabwe and Sri Lanka. Nevertheless, it wasn’t a stroll in the park against India, Pakistan and West Indies.
Apart from Pakistan, their T20 endeavours have seen a smooth ride. Their loss versus Zimbabwe in Durban during the 2007 World T20, stills remains to be the lowest point of Australia in T20’s.
Tests
| Opposition | Matches | Toss(Win) | Won | Lost | Draw | Win % |
| South Africa | 3 | 1 | 2 | - | 1 | 66.67 |
| Pakistan | 7 | 4 | 4 | 3 | - | 57.14 |
One Day Internationals
| Opposition | Matches | Toss(Win) | Won | Lost | Draw | Win% |
| Bangladesh | 7 | 5 | 6 | 1 | - | 85.71 |
| England | 8 | 5 | 6 | 2 | - | 75.00 |
| India | 24 | 13 | 12 | 9 | 3 | 50.00 |
| New Zealand | 19 | 8 | 17 | 1 | 1 | 89.47 |
| Pakistan | 33 | 15 | 19 | 11 | 3 | 57.57 |
| South Africa | 17 | 7 | 9 | 6 | 2 | 52.94 |
| Sri Lanka | 10 | 6 | 8 | 2 | - | 80.00 |
| West Indies | 14 | 10 | 7 | 7 | - | 50.00 |
| Zimbabwe | 10 | 5 | 9 | 1 | - | 90.00 |
T20s
| Opposition | Matches | Toss(Win) | Won | Lost | Draw | Win% |
| Bangladesh | 3 | 3 | 3 | - | - | 100% |
| England | 2 | 2 | 1 | 1 | - | 50% |
| India | 4 | 1 | 2 | 2 | - | 50% |
| New Zealand | 1 | - | - | 1 | - | 0 |
| Pakistan | 13 | 5 | 5 | 7 | 1 | 38.46% |
| South Africa | 1 | 1 | 1 | - | - | 100% |
| Sri Lanka | 3 | 2 | 2 | 1 | - | 66.67% |
| West Indies | 4 | 2 | 1 | 3 | - | 25.00% |
| Zimbabwe | 1 | 1 | - | 1 | - | 0 |
Bangladesh
Bangladesh have won a handful of matches, but they have recently shown that on their day, they can send any team packing. They have won 5 of the 6 ODI wins in neutral venues, with 4 of them coming in World Cups. The tri-series match versus Australia at Cardiff in 2004 will be etched in memory as one of their remarkable ODI wins at neutral venues.
In the 2007 Caribbean World Cup, they showed the door to the Indian cricket team and in 2015, they humiliated England and reached the quarterfinals.
Pakistan fell to Bangladesh during the 1999 World Cup, when the World Cup debutants rolled over the favourites by a comprehensive margin. In T20’s they have had very little success. The victory against West Indies in the 2007 World T20 remains to be their only triumph at neutral venues.
One Day Internationals
Opposition | Matches | Toss(Win) | Won | Lost | Draw | Win% |
| Australia | 7 | 2 | 1 | 6 | - | 14.28 |
| England | 3 | 1 | 1 | 2 | - | 33.33 |
| India | 7 | 3 | 1 | 6 | - | 14.28 |
| New Zealand | 5 | 2 | - | 5 | - | 0 |
| Pakistan | 7 | 2 | 1 | 6 | - | 14.28 |
| South Africa | 2 | 1 | 1 | 1 | - | 50.00 |
| Sri Lanka | 8 | 4 | 0 | 8 | - | 0 |
| West Indies | 4 | 4 | - | 3 | 1 | 0 |
| Zimbabwe | 3 | - | 1 | 2 | - |
T20s
| Opposition | Matches | Toss(Win) | Won | Lost | Draw | Win% |
| Australia | 3 | - | - | 3 | - | 0 |
| India | 1 | - | - | 1 | - | 0 |
| New Zealand | 2 | 1 | - | 2 | - | 0 |
| Pakistan | 5 | 2 | - | 5 | - | 0 |
| Sri Lanka | 1 | 1 | - | 1 | - | 0 |
| West Indies | 1 | 1 | 1 | - | - | 100 |
England

England’s adventure at neutral venues in Test cricket has been equivalent to a dreadful nightmare. In 6 attempts, they were rolled over 5 times, all versus Pakistan and all games played in the United Arab Emirates.
The ODI format has been a mixed bag for the English. Against Pakistan, Sri Lanka and West Indies, they have managed wins, but they have struggled against the likes of India and New Zealand. Even against Zimbabwe, they have a dismal win percentage of 42.86.
Out of the 28 T20’s England has played, they have won 57.14% of their matches. They have got a stranglehold of Pakistan and Sri Lanka in the shortest format with win percentages of 66.67 and 100 respectively.
Tests
| Opposition | Matches | Toss(Win) | Won | Lost | Draw | Win% |
| Pakistan | 6 | 1 | - | 5 | 1 | 0 |
One Day Internationals
| Opposition | Matches | Toss(Win) | Won | Lost | Draw | Win% |
| Australia | 8 | 3 | 2 | 6 | - | 25 |
| Bangladesh | 3 | 2 | 2 | 1 | - | 66.67 |
| India | 10 | 4 | 4 | 6 | - | 40.00 |
| New Zealand | 16 | 5 | 6 | 10 | - | 37.50 |
| Pakistan | 21 | 12 | 14 | 6 | 1 | 66.67 |
| South Africa | 7 | 5 | 3 | 4 | - | 42.85 |
| Sri Lanka | 17 | 11 | 11 | 6 | - | 64.70 |
| West Indies | 19 | 8 | 12 | 6 | 1 | 63.16 |
| Zimbabwe | 7 | 3 | 3 | 3 | 1 | 42.86 |
T20s
| Opposition | Matches | Toss(Win) | Won | Lost | Draw | Win% |
| Australia | 2 | 2 | 1 | 1 | - | 50 |
| India | 2 | 1 | - | 2 | - | 0 |
| New Zealand | 5 | 2 | 3 | 2 | - | 60 |
| Pakistan | 9 | 7 | 6 | 2 | 1 | 66.67 |
| South Africa | 3 | 3 | 2 | 1 | - | 66.67 |
| Sri Lanka | 3 | 1 | 3 | - | - | 100 |
| West Indies | 3 | - | - | 3 | - | 0 |
| Zimbabwe | 1 | 1 | 1 | - | - | 100 |
India
India has been a disappointment in the ODI format with win percentages of above 80 only against Bangladesh and Zimbabwe. They haven’t found it a cakewalk against Australia, Pakistan and South Africa with win percentages of 37.50, 39.72 and 34.78 respectively.
Their triumph against West Indies at Lords in the 1983 World Cup final is indeed their most notable win at a neutral venue. India won their maiden contest in T20s against South Africa at Johannesburg in 2006. The match was Sachin Tendulkar’s only International T20 contest.
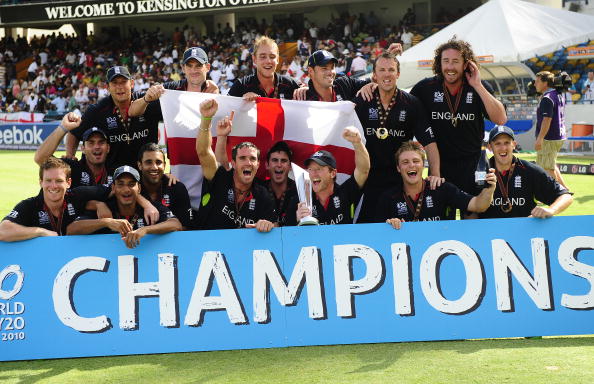
They have been consistent against Pakistan and South Africa with win percentages of 80 and 75 respectively. Their biggest win came in the finals of the 2007 World T20, when they overhauled Pakistan to be crowned as the winners of the inaugural T20 World Cup.
One Day Internationals
| Opposition | Matches | Toss(Won) | Win | Lost | Draw | Win% |
| Australia | 24 | 11 | 9 | 12 | 3 | 37.50 |
| Bangladesh | 7 | 4 | 6 | 1 | - | 85.71 |
| England | 10 | 6 | 6 | 4 | - | 60.00 |
| New Zealand | 33 | 18 | 15 | 15 | 3 | 45.45 |
| Pakistan | 73 | 38 | 29 | 39 | 5 | 39.72 |
| South Africa | 23 | 13 | 8 | 11 | 4 | 34.78 |
| Sri Lanka | 45 | 22 | 26 | 16 | 3 | 57.78 |
| West Indies | 35 | 20 | 18 | 15 | 2 | 51.43 |
| Zimbabwe | 21 | 15 | 17 | 3 | 1 | 80.95 |
T20s
| Opposition | Matches | Toss(Win) | Win | Loss | Draw | Win% |
| Australia | 4 | 3 | 2 | 2 | - | 50.00 |
| Bangladesh | 1 | 1 | 1 | - | - | 100.00 |
| England | 2 | 1 | 2 | - | - | 100.00 |
| New Zealand | 1 | 1 | - | 1 | - | 0.00 |
| Pakistan | 5 | 3 | 4 | - | 1 | 80.00 |
| South Africa | 4 | - | 3 | 1 | - | 75.00 |
| Sri Lanka | 3 | 2 | 1 | 2 | - | 33.33 |
| West Indies | 4 | 4 | 1 | 2 | 1 | 25.00 |
New Zealand
The Kiwis haven’t found it easy to topple oppositions at neutral venues. They have ammunition in their repertoire but somehow have been edged out quite a few times in all the 3 international formats. Their Test record includes matches in the United Arab Emirates and even if they didn’t lose the series, they weren’t under the skins of Pakistan during the entire length of the series in 2014.
Apart from performances against Bangladesh and Zimbabwe, they have put up a bleak show against all other opposition. Against the Kangaroos they have managed just a solitary win in 19 attempts. Pakistan, West Indies and South Africa weren’t easy either for the Black Caps.
Though they have played very little in the T20 format, but even in the short spell, they haven’t got statistics to boast of. The Kiwis made a meal of their games versus Pakistan, losing 6 of the 9 games. They are yet to win a neutral venue T20 against Australia and South Africa.
Tests
| Opposition | Matches | Toss(Won) | Win | Loss | Draw | Win% |
| Pakistan | 3 | 1 | 1 | 1 | 1 | 33.33 |
One Day Internationals
| Opposition | Matches | Toss(Won) | Win | Loss | Draw | Win% |
| Australia | 19 | 11 | 1 | 17 | 1 | 5.26 |
| Bangladesh | 5 | 3 | 5 | - | - | 100 |
| England | 16 | 11 | 10 | 6 | - | 62.5 |
| India | 33 | 14 | 15 | 15 | 3 | 45.45 |
| Pakistan | 34 | 18 | 13 | 21 | - | 38.23 |
| South Africa | 20 | 8 | 7 | 12 | 1 | 35.00 |
| Sri Lanka | 28 | 10 | 14 | 12 | 2 | 50.00 |
| West Indies | 12 | 4 | 3 | 5 | 4 | 25.00 |
| Zimbabwe | 7 | 1 | 6 | - | 1 | 85.71 |
T20s
| Opposition | Matches | Toss(Win) | Win | Loss | Draw | Win% |
| Australia | 1 | 1 | - | 1 | - | 0.00 |
| Bangladesh | 2 | 1 | 2 | - | - | 100 |
| England | 5 | 3 | 2 | 3 | - | 40.00 |
| India | 1 | - | 1 | - | - | 100,00 |
| Pakistan | 9 | 4 | 3 | 6 | - | 33.33 |
| South Africa | 3 | 2 | - | 3 | - | 0.00 |
| Sri Lanka | 6 | 4 | 2 | 4 | - | 33.33 |
| West Indies | 3 | 2 | - | 2 | 1 | 0.00 |
| Zimbabwe | 1 | 1 | 1 | - | - | 100.00 |
Pakistan
Due to major security issues, Pakistan has rarely played on their home turf recently. Dubai, Sharjah and Abu Dhabi have been their home grounds. Though they are neutral venues, since 2009, they have been the home turf for the men in green.
England has been their favourite prey in the Test format, defeating them 5 times in six games. Australia made them strain every sinew, but even the Kangaroos stumbled by 3-0 in the 2014 Test series in the UAE.
In the ODI format against Australia, England and South Africa, they have an aggregate win percentage of 29.27 in 82 games. Even during the generations of Wasim and Waqar, they won very few, which come as a bit of a surprise.
Other than England, they have been pretty good against all the other teams. They have won a World T20 title in 2009, finalists in 2007 and semi-finalist in 2010. Under leaders like Shahid Afridi and Misbah-ul-Haq, Pakistan are a tough side to get over.
Tests
| Opposition | Matches | Toss(Win) | Win | Loss | Draw | Win% |
| Australia | 7 | 4 | 3 | 4 | - | 42.86 |
| England | 6 | 5 | 5 | - | 1 | 83.33 |
| New Zealand | 3 | 2 | 1 | 1 | 1 | 33.33 |
| South Africa | 4 | 2 | 1 | 1 | 2 | 25.00 |
| Sri Lanka | 7 | 2 | 3 | 1 | 3 | 42.86 |
| West Indies | 5 | 4 | 4 | 1 | - | 80.00 |
One Day Internationals
| Opposition | Matches | Toss(Win) | Win | Loss | Draw | Win% |
| Australia | 33 | 16 | 11 | 19 | 3 | 33.33 |
| Bangladesh | 7 | 5 | 6 | 1 | - | 85.71 |
| England | 21 | 9 | 6 | 14 | 1 | 28.57 |
| India | 73 | 32 | 39 | 29 | 5 | 53.42 |
| New Zealand | 34 | 16 | 21 | 13 | - | 61.76 |
| South Africa | 28 | 13 | 7 | 21 | - | 25.00 |
| Sri Lanka | 78 | 30 | 50 | 26 | 2 | 64.10 |
| West Indies | 74 | 42 | 34 | 40 | - | 45.94 |
| Zimbabwe | 14 | 7 | 14 | - | - | 100.00 |
T20s
| Opposition | Matches | Toss(Win) | Win | Loss | Draw | Win% |
| Australia | 13 | 8 | 7 | 5 | 1 | 53.85 |
| Bangladesh | 5 | 3 | 5 | - | - | 100.00 |
| England | 9 | 2 | 2 | 6 | 1 | 22.22 |
| India | 5 | 2 | - | 4 | 1 | 80.00 |
| New Zealand | 9 | 5 | 6 | 3 | - | 66.67 |
| South Africa | 7 | 5 | 3 | 4 | - | 42.86 |
| Sri Lanka | 9 | 4 | 6 | 3 | - | 66.67 |
| West Indies | 4 | 2 | 3 | 1 | - | 75.00 |
| Zimbabwe | 1 | - | 1 | - | - | 0.00 |
South Africa
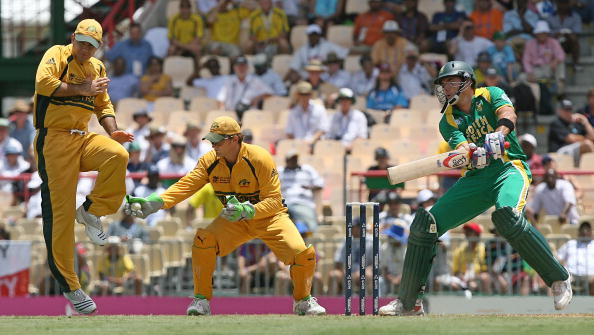
The first match that comes to mind with regard to neutral venue matches is the World Cup semi-final contest in the 1999 World Cup match versus Australia. Embarrassingly enough, the match earned them the tag of ‘chokers.’
The Proteas got a solitary win Test matches at neutral venues and it was against Pakistan. In ODIs, they have fared decently apart from against Australia, to whom they have a win percentage of 35.29. They have taken a liking to Pakistan, overpowering them in 21 contests out of 28.
In T20’s, they have won 7 out of the 12 games against New Zealand and Pakistan. Nonetheless, they are still to open their account against Australia at neutral grounds.
Tests
| Opposition | Matches | Toss(Win) | Win | Loss | Draw | Win% |
| Australia | 3 | 2 | - | 2 | 1 | 0.00 |
| Pakistan | 4 | 2 | 1 | 1 | 2 | 25.00 |
One Day Internationals
| Opposition | Matches | Toss(Win) | Win | Loss | Draw | Win% |
| Australia | 17 | 10 | 6 | 9 | 2 | 35.29 |
| Bangladesh | 2 | 1 | 1 | 1 | - | 50.00 |
| England | 7 | 2 | 4 | 3 | - | 57.14 |
| India | 23 | 7 | 11 | 8 | 4 | 47.83 |
| New Zealand | 20 | 11 | 12 | 7 | 1 | 60.00 |
| Pakistan | 28 | 15 | 21 | 7 | - | 75.00 |
| Sri Lanka | 18 | 6 | 10 | 8 | - | 55.55 |
| West Indies | 11 | 6 | 7 | 3 | 1 | 63.64 |
| Zimbabwe | 8 | 3 | 6 | 1 | 1 | 75.00 |
T20s
| Opposition | Matches | Toss(Win) | Win | Loss | Draw | Win% |
| Australia | 1 | - | - | 1 | - | 0.00 |
| England | 3 | - | 1 | 2 | - | 33.33 |
| India | 4 | 4 | 1 | 3 | - | 33.33 |
| New Zealand | 3 | 1 | 3 | - | - | 100.00 |
| Pakistan | 7 | 2 | 4 | 3 | - | 57.14 |
| Sri Lanka | 2 | 1 | 1 | 1 | - | 50.00 |
| West Indies | 2 | - | 1 | 1 | - | 50.00 |
| Zimbabwe | 1 | 1 | 1 | - | - | 100.00 |
Sri Lanka
Sri Lankan cricket was taken notice of after their 1996 World Cup triumph and were bound to lose matches after their entry among the big boys of cricket. Quite astonishingly, they have played some stupendous cricket and didn’t let the percentages drop significantly.
In Test cricket, they struggled to find their feet in the 7 games, winning just one of them. In the ODI format, they were far from rusty. Even after a late entry into world cricket, Sri Lanka has done exceedingly well.
Against New Zealand and South Africa, they average 42.86 and 44.44 which is commendable. In the T20 format they haven’t disappointed either. West Indies found it tough in overhauling them. Even T20 powerhouses in India and New Zealand bowed down helplessly to the Lankans.
Tests
| Opposition | Matches | Toss(Win) | Win | Loss | Draw | Win% |
| Pakistan | 7 | 5 | 1 | 3 | 3 | 14.28 |
One Day Internationals
| Opposition | Matches | Toss(Win) | Win | Loss | Draw | Win% |
| Australia | 10 | 4 | 2 | 8 | - | 20.00 |
| Bangladesh | 8 | 4 | 8 | - | - | 100.00 |
| England | 17 | 6 | 6 | 11 | - | 35.29 |
| India | 45 | 23 | 16 | 26 | 3 | 35.55 |
| New Zealand | 28 | 18 | 12 | 14 | 2 | 42.86 |
| Pakistan | 78 | 48 | 26 | 50 | 2 | 33.33 |
| South Africa | 18 | 12 | 8 | 10 | - | 44.44 |
| West Indies | 30 | 16 | 10 | 19 | 1 | 33.33 |
| Zimbabwe | 19 | 13 | 14 | 4 | 1 | 73.68 |
T20s
| Opposition | Matches | Toss(Win) | Win | Loss | Draw | Win% |
| Australia | 3 | 1 | 1 | 2 | - | 33.33 |
| Bangladesh | 1 | - | 1 | - | - | 100.00 |
| England | 3 | 2 | - | 3 | - | 0.00 |
| India | 3 | 1 | 2 | 1 | - | 66.67 |
| New Zealand | 6 | 2 | 4 | 2 | - | 66.67 |
| Pakistan | 9 | 5 | 3 | 6 | - | 33.33 |
| South Africa | 2 | 1 | 1 | - | - | 50.00 |
| West Indies | 4 | 1 | 3 | 1 | - | 75.00 |
West Indies

The Caribbean team has struggled in the past when facing opponents on neutral venues. In the ODI format, barring Zimbabwe and Bangladesh, they haven’t quite got the better of oppositions. They have played the most number of neutral venue ODIs versus Pakistan with a win percentage of 54.05.
Against England and South Africa the win percentages are 31.58 and 27.27 respectively. The fact that they have won the 1975 and 1979 World Cup at neutral venues is something to cheer about for Caribbean cricket.
T20 has been a strong point for the men from West Indies. Against England, they enjoy a win percentage of 100. The only embarrassing moment came in the 2007 World T20, when Bangladesh ousted them after the group stage.
Tests
| Opposition | Matches | Toss(Win) | Win | Loss | Draw | Win% |
| Pakistan | 5 | 1 | 1 | 4 | - | 20.00 |
One Day Internationals
| Oppositions | Matches | Toss(Win) | Win | Loss | Draw | Win% |
| Australia | 14 | 4 | 7 | 7 | - | 50.00 |
| Bangladesh | 4 | - | 3 | - | 1 | 75.00 |
| England | 19 | 10 | 6 | 12 | 1 | 31.58 |
| India | 35 | 15 | 15 | 18 | 2 | 42.86 |
| New Zealand | 12 | 8 | 5 | 3 | 4 | 41.67 |
| Pakistan | 74 | 32 | 40 | 34 | - | 54.05 |
| South Africa | 11 | 5 | 3 | 2 | 1 | 27.27 |
| Sri Lanka | 30 | 13 | 19 | 10 | 1 | 63.33 |
| Zimbabwe | 17 | 10 | 12 | 5 | - | 70.59 |
T20s
| Opposition | Matches | Toss(Win) | Win | Loss | Draw | Win% |
| Australia | 4 | 2 | 3 | 1 | - | 75.00 |
| Bangladesh | 1 | - | - | 1 | - | 0.00 |
| England | 3 | 3 | 3 | - | - | 100.00 |
| India | 4 | - | 2 | 1 | - | 50.00 |
| New Zealand | 3 | 1 | 2 | - | 1 | 66.67 |
| Pakistan | 4 | 2 | 1 | 3 | - | 25.00 |
| South Africa | 2 | 2 | 1 | 1 | - | 50.00 |
| Sri Lanka | 4 | 3 | 1 | 3 | - | 25.00 |
Zimbabwe
Zimbabwe enjoys a decent win percentage of 66.67 against Bangladesh. Their next favourite team is England, whom they have beaten 3 times out of 7. They have lost all their 14 neutral matches versus Pakistan. The records are not worth cherishing for the Zimbabweans.
In the T20 format, they have won a solitary game against Australia way back in 2007. Other than that they are yet to win anything at neutral venues. There is room for improvement in Zimbabwean cricket and it will take time for them to beat cricketing giants at neutral venues.
One Day Internationals
| Oppositions | Matches | Toss(Win) | Win | Loss | Draw | Win% |
| Australia | 10 | 5 | 1 | 9 | - | 10.00 |
| Bangladesh | 3 | 3 | 2 | 1 | - | 66.67 |
| England | 7 | 3 | 3 | 3 | 1 | 42.86 |
| India | 21 | 6 | 3 | 17 | 1 | 14.28 |
| New Zealand | 7 | 6 | - | 6 | 1 | 0.00 |
| Pakistan | 14 | 7 | - | 14 | - | 0.00 |
| South Africa | 8 | 5 | 1 | 6 | 1 | 12.50 |
| Sri Lanka | 19 | 5 | 4 | 14 | 1 | 21.05 |
| West Indies | 17 | 7 | 5 | 12 | - | 29.41 |
T20s
| Opposition | Matches | Toss(Win) | Win | Loss | Draw | Win% |
| Australia | 1 | - | 1 | - | - | 100.00 |
| England | 1 | - | - | 1 | - | 0.00 |
| New Zealand | 1 | - | - | 1 | - | 0.00 |
| Pakistan | 1 | - | - | 1 | - | 0.00 |
| South Africa | 1 | - | - | 1 | - | 0.00 |
| Sri Lanka | 2 | - | - | 2 | - | 0.00 |
Adjusting to neutral venues

The toss is an important factor in cricket, and even more crucial in neutral venues. Conditions are assessed, the pitch is examined and the dew factor is also taken into consideration before taking a decision to either bat or send the opposition in.
Losing a toss isn’t a start desired for, but some teams don’t get bogged down and don’t let the toss, turn the match on its head.
The following table tells us how teams fare after losing the toss. It shows the difference between the frequency of wins to the frequency of tosses which are won. If the difference is positive, then it’s healthy for a team as they win more matches than tosses.
Tests
| Teams | Matches | Toss (Won) | Won | Loss | Win% | Toss(Win %) | Difference (Win%-Toss-Win%) |
| Australia | 10 | 5 | 6 | 3 | 60.00 | 50.00 | +10.00 |
| England | 6 | 1 | - | 5 | 0.00 | 16.67 | -16.67 |
| New Zealand | 3 | 1 | 1 | 1 | 33.33 | 33.33 | +0.00 |
| Pakistan | 32 | 19 | 17 | 8 | 53.12 | 59.37 | -6.25 |
| South Africa | 7 | 4 | 1 | 3 | 14.28 | 57.14 | -42.86 |
| Sri Lanka | 7 | 5 | 1 | 3 | 14.28 | 71.43 | -57.15 |
| West Indies | 5 | 1 | 1 | 4 | 20.00 | 20.00 | +0.00 |
One Day Internationals
| Teams | Matches | Toss (Won) | Won | Loss | Win% | Toss(Win %) | Difference (Win%-Toss-Win%) |
| Australia | 142 | 74 | 93 | 40 | 65.49 | 52.11 | +13.38 |
| Bangladesh | 49 | 19 | 6 | 39 | 12.24 | 38.77 | -26.53 |
| England | 108 | 53 | 57 | 48 | 52.78 | 49.07 | +3.71 |
| India | 271 | 147 | 134 | 116 | 49.45 | 54.24 | -4.79 |
| New Zealand | 174 | 80 | 74 | 88 | 42.53 | 45.98 | -3.45 |
| Pakistan | 362 | 170 | 188 | 163 | 51.93 | 46.96 | +4.97 |
| South Africa | 134 | 61 | 78 | 47 | 58.21 | 45.52 | +12.69 |
| Sri Lanka | 253 | 144 | 102 | 142 | 40.31 | 56.92 | -16.61 |
| West Indies | 216 | 97 | 110 | 91 | 50.92 | 42.13 | +8.79 |
| Zimbabwe | 106 | 47 | 19 | 82 | 17.92 | 44.34 | -26.42 |
T20s
| Teams | Matches | Toss (Won) | Won | Loss | Win% | Toss(Win %) | Difference (Win%-Toss-Win%) |
| Australia | 32 | 17 | 15 | 16 | 46.87 | 53.12 | -6.25 |
| Bangladesh | 13 | 5 | 1 | 12 | 7.69 | 38.46 | -30.77 |
| England | 28 | 17 | 16 | 11 | 57.14 | 60.71 | -3.57 |
| India | 24 | 15 | 14 | 8 | 58.33 | 62.50 | -4.17 |
| New Zealand | 31 | 18 | 11 | 19 | 35.48 | 58.06 | -22.58 |
| Pakistan | 62 | 31 | 33 | 26 | 53.22 | 50.00 | +3.22 |
| South Africa | 23 | 9 | 12 | 11 | 52.17 | 39.13 | +13.04 |
| Sri Lanka | 31 | 13 | 15 | 15 | 48.39 | 41.93 | +6.46 |
| West Indies | 25 | 13 | 13 | 10 | 52.00 | 52.00 | +0.00 |
| Zimbabwe | 7 | - | 1 | 6 | 14.28 | 0.00 | +14.28 |

Follow IPL Auction 2025 Live Updates, News & Biddings at Sportskeeda. Get the fastest updates on Mega-Auction and cricket news