NBA teams have drastically improved their scoring over the past few decades. In the 2022-23 season, teams are scoring 114.2 points per game, which is the ninth-highest mark in the history of the league.
Ad
In fact, this is the highest scoring average the league has ever seen since the 1969-70 season, when teams scored 116.7 points on average. Considering how basketball has evolved over the past 10 years, we can expect the scoring average to increase even more.
This article will reveal the average scoring pace of teams since the league's inception. We will take a look at how the game has changed over the past few decades and what contributes to the scoring increase.
Explore the NBA Draft 2024 with our free NBA Mock Draft Simulator & be the GM of your favorite NBA team.
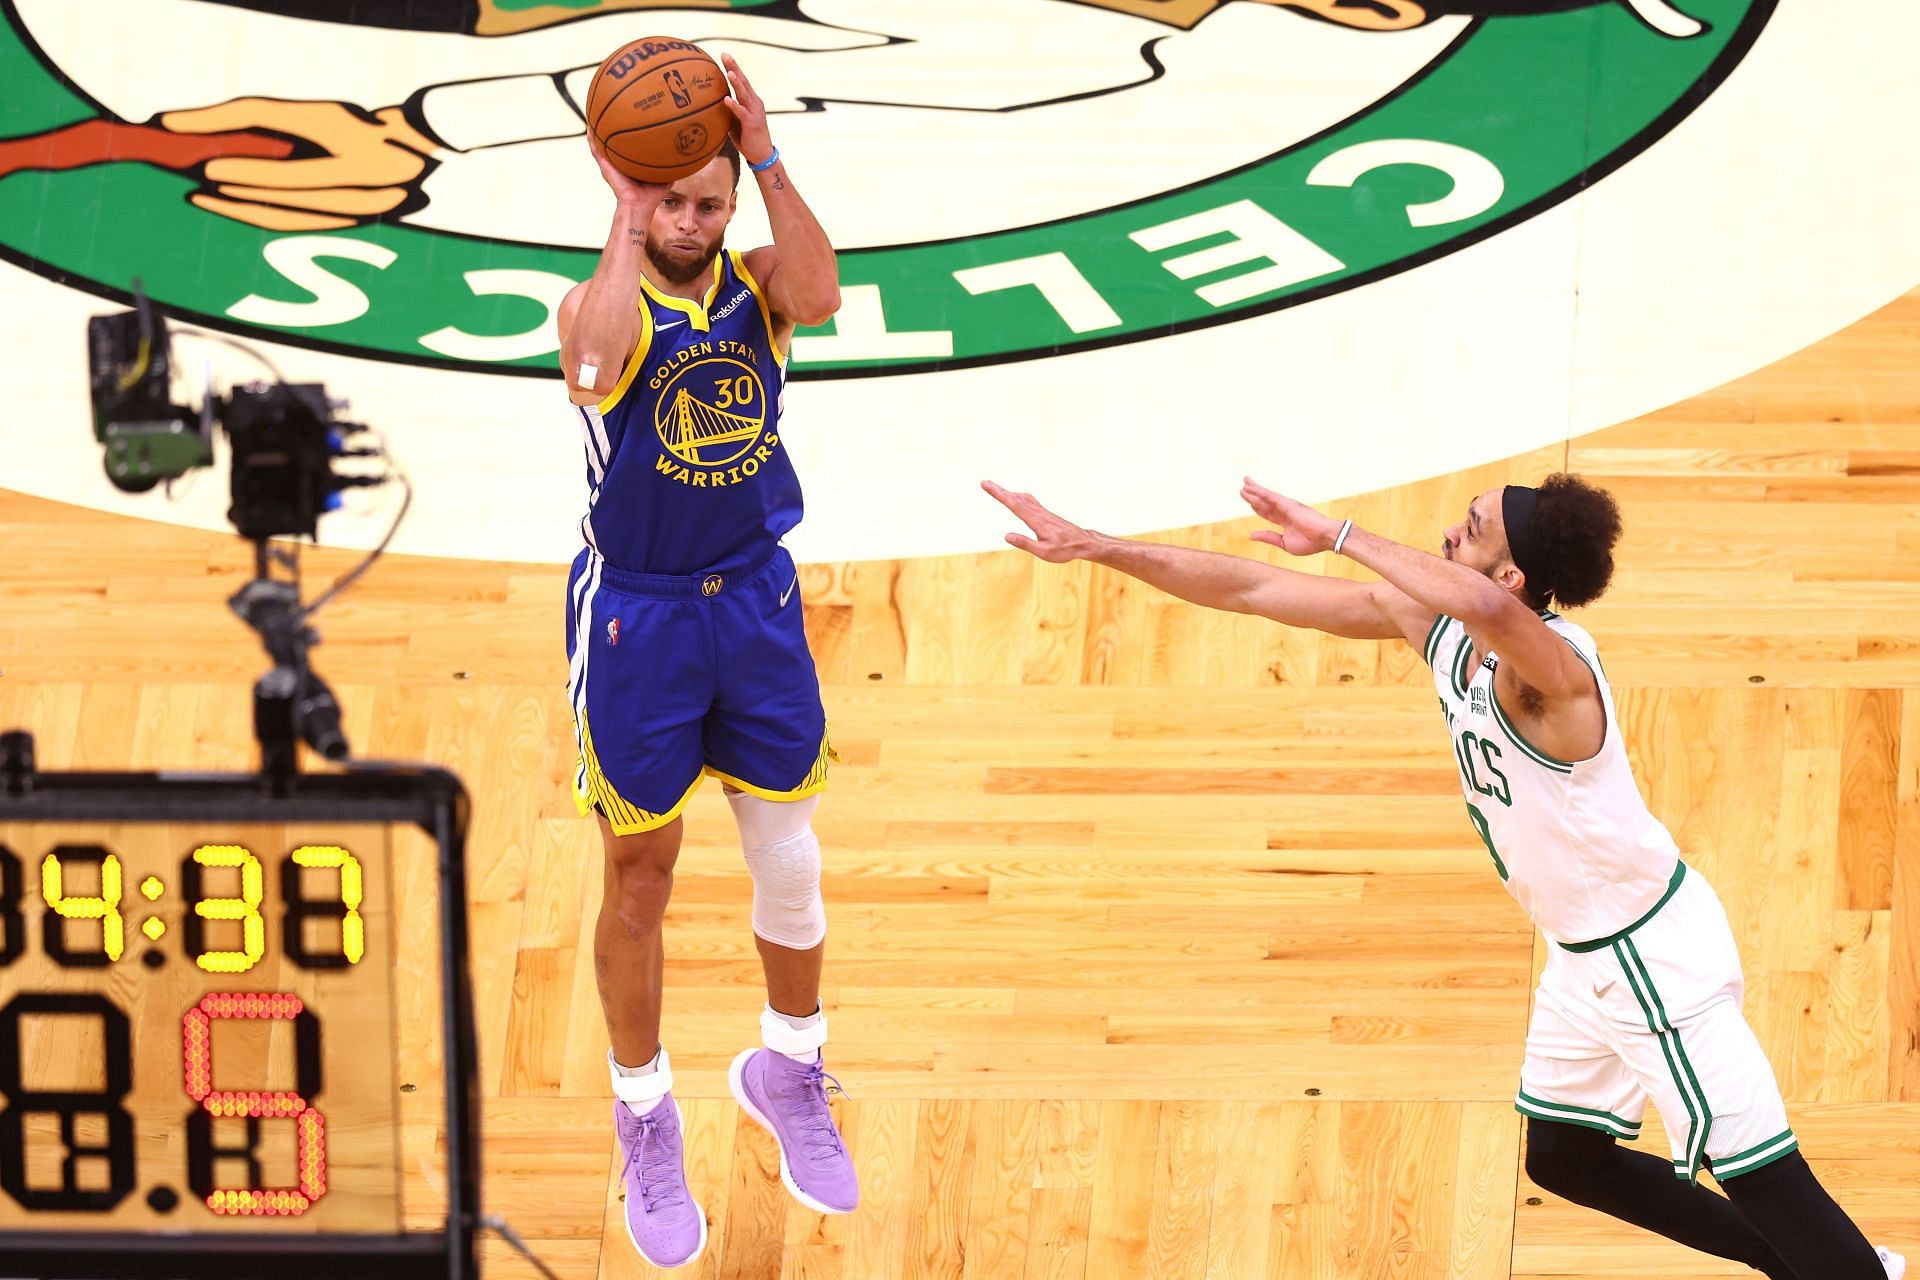
NBA teams are scoring more efficiently thanks to the evolution of the 3-point shot
The last time the NBA averaged under 100 points per game was in the 2012-13 season, with an average scoring mark of 98.1 PPG. Not only was the scoring average low, but teams also averaged 20.0 3-point attempts per game.
Both 3-point shot attempts and scoring averages have drastically increased since then. In the 2022-23 season, NBA teams average 34.2 long-range shots per game, which is 71% higher than the 3-point attempt average from 10 years ago.
Ad
Basketball teams rely on 3-point shooting much more than before.
Besides the increase in 3-point shooting, basketball is much faster now. A decade ago, teams averaged 91.3 possessions per game. However, this number has increased to 99.3 in the current season, an 8.7% increase.
When it comes to scoring pace, the mark of 114.2 points per 100 possessions is the highest in the history of the league. Additionally, the combined shooting percentage of 47.3% is ranked 14th all-time, while the 3-point percentage of 36.0% is ranked sixth.
Finally, the professional basketball league has never been this efficient in shooting free throws. The free throw percentage of 78.0% is 0.2 percentage points better than the previous mark.
Ad
Scoring average year-by-year
The table below shows the scoring average in the NBA year-by-year. As you can see, the scoring average has drastically increased over the past decade and will most likely keep increasing as teams get more and more 3-point specialists.
The table shows all the important stats regarding scoring, from simple stats such as field-goal attempts per game to advanced stats like offensive rating.
Considering how drastically basketball has changed over the past 10 years, it won't be surprising if one season from this decade breaks the all-time scoring average.
The highest-scoring season of all time was the 1961-62 season when teams averaged 118.8 points per game. Interestingly, teams shot only 42.6% from the field that season, which is much lower than the combined shooting percentage in the current season.
×
Feedback
Why did you not like this content?
Was this article helpful?
Thank You for feedback
About the author
Asmir Pekmic
Besides playing basketball both in video games and in real life, Asmir is a longtime fan of the Miami Heat. Even though Dwyane Wade, his favorite player, retired, he still finds joy in watching the current squad led by Jimmy Butler. By the age of 30, he's seen many fantastic moments, but Ray Allen's "The Shot" and D-Wade's game-winning buzzer-beater against the Bulls are his favorites.
Asmir comes from Bosnia and Herzegovina and he's been with Sportskeeda since May 2022.


'%20x='0'%20y='0'%20height='100%25'%20width='100%25'%20xlink%3Ahref='data:image/jpg;base64,/9j/2wBDAAYEBQYFBAYGBQYHBwYIChAKCgkJChQODwwQFxQYGBcUFhYaHSUfGhsjHBYWICwgIyYnKSopGR8tMC0oMCUoKSj/2wBDAQcHBwoIChMKChMoGhYaKCgoKCgoKCgoKCgoKCgoKCgoKCgoKCgoKCgoKCgoKCgoKCgoKCgoKCgoKCgoKCgoKCj/wgARCAAGAAoDASIAAhEBAxEB/8QAFgABAQEAAAAAAAAAAAAAAAAAAAYH/8QAFQEBAQAAAAAAAAAAAAAAAAAABAX/2gAMAwEAAhADEAAAAMdvAd3/xAAhEAACAQMDBQAAAAAAAAAAAAABAwIABBEFBhIIEyFR0v/aAAgBAQABPwDa7o3sLazuVcw9kV8+5IYyfQp/TpuMuYV6powhnxks+K//xAAXEQEAAwAAAAAAAAAAAAAAAAABAAIh/9oACAECAQE/AKus/8QAGREAAgMBAAAAAAAAAAAAAAAAAQIABCJB/9oACAEDAQE/ALWEQA8n/9k='%3E%3C/image%3E%3C/svg%3E)