
'%20x='0'%20y='0'%20height='100%25'%20width='100%25'%20%0A%20%20%20%20%20%20%20%20%20%20xlink%3Ahref='data:image/jpg;base64,/9j/2wBDAAYEBQYFBAYGBQYHBwYIChAKCgkJChQODwwQFxQYGBcUFhYaHSUfGhsjHBYWICwgIyYnKSopGR8tMC0oMCUoKSj/2wBDAQcHBwoIChMKChMoGhYaKCgoKCgoKCgoKCgoKCgoKCgoKCgoKCgoKCgoKCgoKCgoKCgoKCgoKCgoKCgoKCgoKCj/wgARCAAIAAoDASIAAhEBAxEB/8QAFQABAQAAAAAAAAAAAAAAAAAABAf/2gAIAQEAAAAAmzP/xAAUAQEAAAAAAAAAAAAAAAAAAAAF/9oACAECEAAAACf/xAAUAQEAAAAAAAAAAAAAAAAAAAAD/9oACAEDEAAAAH//xAAfEAACAQQCAwAAAAAAAAAAAAABAwIABAUSEVETFSH/2gAIAQEAAT8Aba4NV3OzTi7NylRa3aTPGz4NQZDrmMiB1IUrBY1ioT9ZajYCXGsa/8QAGREBAQADAQAAAAAAAAAAAAAAAQIABBGB/9oACAECAQE/ANyORLKnrn//xAAWEQEBAQAAAAAAAAAAAAAAAAABAgD/2gAIAQMBAT8AhW03/9k='%3E%3C/image%3E%3C/svg%3E)
Have you ever checked a company’s balance sheet? If yes, you must have seen a lot of headers such as shareholder’s equity, retained earnings, long-term debt, current assets, fixed assets, inventory, machines and equipments etc. Each of them are mutually exclusive and yet they feature in the same balance sheet. Somehow, the financial managers have devised a way to bring them all to a platform, where they can be easily compared, added and subtracted to each other. This is done by converting each of the header into monetary terms.
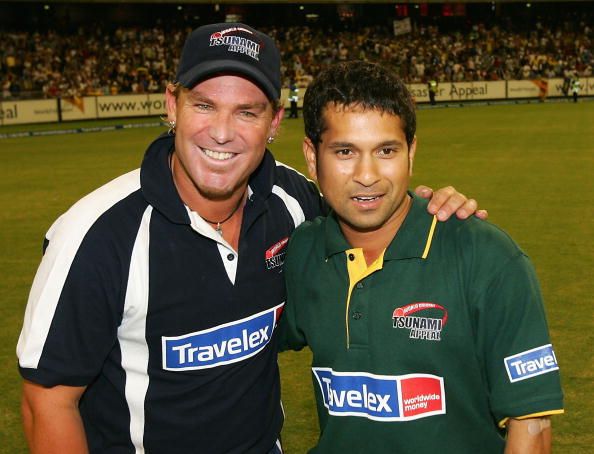
In cricket, we can compare batsmen. We can compare the number of runs scored by each of them, the number of centuries, half-centuries and similar milestones. Bowlers have their own parameters of comparison. However, if I were to ask you, who has been a greater contributor to the game between Ricky Ponting and Shane Warne, what would be your answer?
By ‘Contributor’, I do not mean who has been a better player, who has led the team to maximum victories or who has played multiple roles in the team – wicket-keeper batsman, all-rounder or the skipper. I simply seek to find the player who has given his maximum to the game, by bringing all possible milestones under a single unit of comparison.
The first question that needs to be addressed is – ‘How do we compare a run and a wicket?’ Subsequently, I will try to find out how many runs are there to a wicket. Is a century equivalent to a five-wicket haul? Are 100 Test wickets equivalent to 2500 Test runs or more, or less? If yes, then we can find the cricketer to have had the maximum impact on the game.
To find the value of a wicket in ODIs, I took a sample of 30 random ODIs played in 2012. The chosen matches though random, were carefully picked in a manner such that they contained every possible variation of an ODI – a high-scoring game, a low-scoring game, targets truncated using D/L method, matches between top teams, between minnows and between a minnow and a top side.
This sample showed that a total of 12,878 runs were scored in these 30 matches. 422 wickets were lost to produce these runs. By using simple arithmetic unitary method, we can evaluate the value of each wicket in terms of runs.
Runs per wicket = 12,878/422 = 30.5166
This is value is outstandingly high. And rightly so. The curators today have a predilection to produce featherbeds on which batsmen feast. This has resulted in a huge number of high scoring games. Chasing 300 is no more a monumental task. Bowlers having an economy in excess of 5.50 runs per over and a bowling average beyond 30 but below 35 are considered wonderful. Thus, valuing a wicket at 30.5 runs (approximately) sounds contemporary.
Using the above parameter, let us see how the best ODI players have fared in the contribution list. But before glancing at the list, let me make certain assumptions.
i) The ratings evaluated include efforts only with bat and bowl. Efforts in the field are neglected except for wicket-keepers. The wicket-keepers earn 30 points for every stumping and 20 points (to even out the dollies and exemplary catches) for every catch.
ii) The analysis does not take into consideration the match situation. It is evaluated in absolute terms. The evaluation is quantitative, not qualitative.
iii) It does not define any criteria to find the Man-of-the-Match.
iv) Every run scored gets a point, every wicket gets 30.5 points, each catch by a keeper fetches 20 points while a stumping is worth 30 points.
Using the above rating system, the top five contributors to ODIs are :
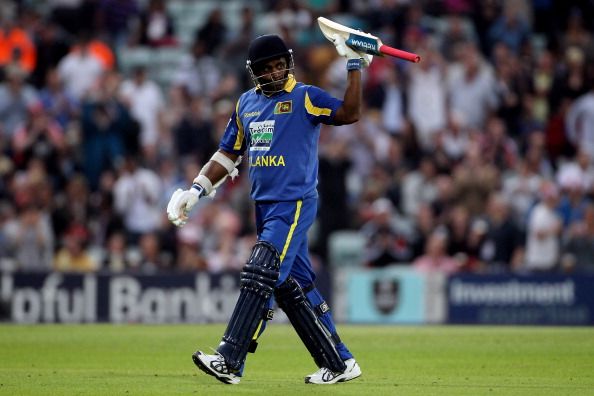
1. Sanath Jayasuriya – 23,282 points
2. Sachin Tendulkar – 23,123 points
3. Kumar Sangakarra – 19,945 points
4. Jacques Kallis – 19,733 points
5. Wasim Akram – 19,028 points
The list is interesting. It contains two all-rounders, a master-class batsman, a superb wicket-keeper batsman and one of the best bowlers cricket universe has ever seen. These names are immortal in the history of cricket. Their contribution has left an indelible mark on the game. If the catches of non wicket-keeper players are taken into consideration, Tendulkar leapfrogs past Jayasuriya to be the greatest contributor to ODIs ever.
The longer format of the game is the ultimate test of skills, resilience and dexterity of each player. It not only the test of physical abilities but also the mental abilities of every player. I sampled the last 25 Tests played in 2012. The sample size was sufficient enough to allow me to gauge over 90 Test innings to find the true value of a Test wicket in terms of runs. 2012 was a very interesting year for Test cricket. Right from startling low totals (45 all out) to astoundingly high totals (637/2 declared), the cricket universe saw it all. A good melting pot to pick up my sample, I discovered that 27,647 runs were scored in just 25 matches. Furthermore, 767 wickets were lost in the quest to score those runs.
Test matches witness totals unachievable in ODIs. Hence, it is customary to expect a Test wicket’s value higher than an ODIs wicket. Employing the unitary method again, we find an approximate value of a Test wicket.
Runs per wicket = 27,647/767 = 36.054.
36 runs per wicket ! That speaks a lot about how a wicket is valued in Test matches. Using this comparison parameter, I tried to find the top seven contributors to Test cricket. The list is :
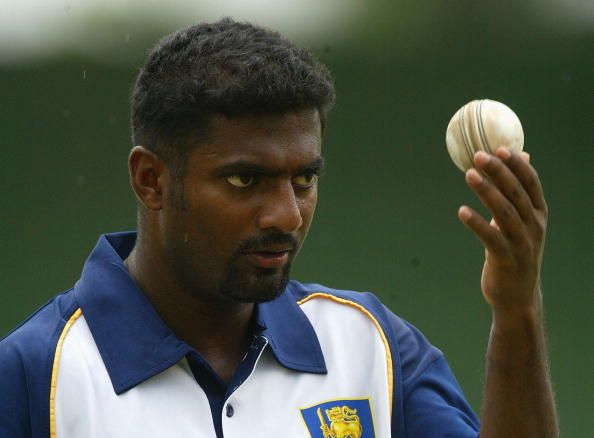
1. Muttiah Muralitharan – 30,061 points
2. Shane Warne – 28,642 points
3. Anil Kumble – 24,790 points
4. Jacques Kallis – 23,496 points
5. Glenn McGrath- 20,909 points
6. Kapil Dev – 20,872 points
7. Mark Boucher – 19,111 points
The game’s biggest contributor
Surprisingly, this list is skewed in favour of the bowlers. Four out of the top seven are specialist bowlers. Two of them are all-rounders. Finally, Mark Boucher, squeezes his way in to create a dominant position for a wicket-keeper batsman.
The Test match list raises many questions than it answers. The primary question is – ‘Are bowlers the more instrumental assets in Test matches with respect to batsmen?’ The answer to this question is ‘Yes’. Australia’s and South Africa’s dominance in Test cricket is primarily subject to their fast bowlers. This does not mean that their batsmen haven’t fared in the expected manner, they certainly have. But on most occasions, the wins have been set up on the basis of their bowlers’ performance.
It is not a myth. We have numerous examples which vindicate the above fact. Sri Lanka still struggles to win Test matches after the retirement of Muralitharan. Once the spin partnership of Kumble-Bhajji was broken, the performance of Indian team started deteriorating. England, Australia and SAF rely on their pacers to win matches played at home. Every team looks up to their bowlers to close games on the final two days of the Test match. Pitches are prepared to suit the bowlers and their bowling style, not the batsmen. If the captain wants a turner, he gets it. I have never heard a captain requesting a belter or a dead pitch in Test matches. It just gives me a perspective that a Test match is a bowler’s game.
P.S. – The list prepared does not intend to belittle the contribution of legendary players we have seen. It is just an endeavour to compare a bowler, a batsman and a wicket-keeper. I respect all cricketers and their vital contribution to the game.
Though not foolproof, it’s an attempt to compare the two very different and basic skills of cricket – batting and bowling. Suggestions are invited in the comments below to improve the algorithm.
Looking for fast live cricket scores? Download CricRocket and get fast score updates, top-notch commentary in-depth match stats & much more! 🚀☄️
